Retrospective Study: Case-Control and Case-Series
Design of Experiments > Retrospective Study Contents:
- Retrospective Study
- Terminology Note
- Advantages and Disadvantages
- Study Steps
- Retrospective Case-Control

Retrospective Case Series
- Retrospective longitudinal study
1. What is a Retrospective Study?
A retrospective study is an observational study that enrolls participants who already have a disease or condition. In other words, all cases have already happened before the study begins. Researchers then look back in time, using questionnaires, medical records and other methods; Basically, you just dig into the data and see what you find. The goal is to find out what potential risk factors or other associations and relationships the group has in common. The opposite of a retrospective study is a prospective study where participants are enrolled before any of them have the disease or outcome being investigated. When both retrospective and prospective methods are used at the same time, the study is said to be ambi-directional .
Unlike most other studies, a retrospective study collects data that have been previously collected for some other reason than research (Hess, 2004).
2. Terminology Note
In epidemiology (i.e. in clinical studies), “case-control” and “retrospective study” are used synonymously. That’s mostly because when dealing with diseases and conditions, you always want to have a control. A historical epidemiological study without a control would be unthinkable, and perhaps even useless. Therefore, if you look at clinical studies, medical sites, or anything to do with medicine, you’ll find the two terms are interchangeable.
However, in other areas (e.g. education, the social sciences), there are different types of possibility for studies such as a retrospective case series , which do not use controls at all.
Back to Top
3. Advantages and Disadvantages
Advantages:
- Useful for rare diseases or unusual exposures .
- Smaller sample sizes .
- Studies take less time, because the data is readily available (it just has to be collected and analyzed).
- Costs are generally lower .
Disadvantages:
- Missing data: Exposure status may not be clear, because important data may not have been collected in the first place. For example, if the study is inverstigating occupational lung cancer rates, information about worker’s smoking habits may not be available.
- Recall bias : Participants may not be able to remember if they were exposed or not.
- Confounding variables are difficult or impossible to measure.
- Retrospective studies are considered to be inferior to prospective studies , so prospective studies should always be used if there is a choice.
- As this is a relatively weak type of study, you cannot make causal statements , although correlations are okay (see: causation vs. correlation ). Therefore, getting the study read and/or published may be difficult.
4. Study Steps
(Adpated from Kalogeropoulos, 2014):
- The study population.
- The time period (how far back in time you’ll get data from).
- Outcomes (are you studying a specific disease outcome? An event occurrence? Something else?
- Collect as much data as possible — preferably quantitative (numerical) data.
- Decide how you’ll defend your study before you implement it.
- Carefully design the database so that you’ll be able to easily analyze your results.
- Enlist other people to help, if possible. For example, you may benefit from getting a database expert to help you design your database.
5. Retrospective cohort study

For example, researchers may want to investigate whether exposure to glues commonly used in carpentry increases the risk of developing COPD. A cohort consisting of retired carpenters might be selected. A control group is also chosen. This might be made up of delivery drivers and clerical workers who would not have been exposed to the glues. Health records and employment records are used for data sources. Due to the fact that data is collected retrospectively in a non-controlled environment, it’s not possible to make statements about causation.
Although you can’t make statements about causation , you can find associations and possible relationships, potentially paving the way for the more expensive, longer-term prospective study .
6. Types of Retrospective cohort study
Retrospective case-control study.
Case-control studies involve two groups of people: people who have the disease (cases) and those who do not (controls). A retrospective case-control uses these two groups and looks back to the past for data and possible risk factors. A matched case-control study chooses controls based on some matching factor, like age, weight or severity of disease.
7. Retrospective longitudinal study
A retrospective longitudinal study involves repeated observations of the variables over a long period of time.
Hess, D. (2004). Retrospective studies and chart reviews. Respiratory Care. 2004 Oct;49(10):1171-4. Kalogeropoulos, A. (2014). Understanding Retrospective vs. Prospective Study designs. Retrieved October 26, 2017 from: http://medicine.emory.edu/documents/research/kalogeropoulos-study-design-talk.pdf Sahai, H. & Khurshid, A. (1995). Statistics in Epidemiology: Methods, Techniques and Applications . CRC Press.
- Skip to secondary menu
- Skip to main content
- Skip to primary sidebar
Statistics By Jim
Making statistics intuitive
Retrospective Study: Definition & Examples
By Jim Frost 1 Comment
What is a Retrospective Study?
A retrospective study an experimental design that looks back in time and assesses events that have already occurred. The researchers already know the outcome for each subject when the project starts. Instead of recording data going forward as events happen, these studies use participant recollection and data that were previously recorded for reasons not relating to the project. These studies typically don’t follow patients into the future.
In retrospective designs, the researchers collect their data using existing records. Consequently, they can complete their assessment more quickly and inexpensively than a prospective study that must follow subjects over time and record the data under carefully controlled conditions. However, the data that a retrospective study uses might not have been measured consistently or accurately because they weren’t explicitly designed to be part of a study.

The statistical analysis for a retrospective study is frequently the same as for prospective designs (looking forward). The main difference is that the project occurs after the outcomes are known rather than how researchers analyze the data.
Statisticians consider retrospective designs to be inferior to prospective methods because they tend to introduce more bias and confounding. Retrospective studies are observational studies by necessity because they assess past events and it is impossible to perform a randomized, controlled experiment with them. However, they can be quicker and cheaper to complete, making them a good choice for preliminary research. Findings from a retrospective study can help inform a prospective experimental design. Learn more about Experimental Designs .
Retrospective Study Designs
Retrospective studies use various designs. While these designs differ in detail, they all tend to compare subjects with and without a condition and determine how they differ. Using the usual hypothesis tests, researchers can determine whether there are statistically significant relationships between subject variables (risk factors , personal characteristics, etc.) and the outcome of interest.
Cohort and case-control studies are standard retrospective designs. Let’s learn more about them!
Retrospective Cohort Study
This study design compares groups of subjects who are similar overall but differ in a particular characteristic, such as exposure to a risk factor. Because it is a retrospective study, the researchers find individuals where the outcomes are known when the project starts. Retrospective cohort studies frequently determine whether exposure to risk and protective factors affects an outcome. These are longitudinal studies that use existing datasets to look back at events that have already occurred. Learn more about Longitudinal Studies: Overview, Examples & Benefits .
In these projects, researchers use databases and medical records to identify patients and gather information about them. They can also ask subjects to recall their exposure over time. Then the researchers analyze the data to determine whether the risk factor correlates with the outcome of interest.
Suppose researchers hypothesize that exposure to a chemical increases skin cancer and conduct a retrospective cohort study. In that case, they can form a cohort based on a group commonly exposed to that chemical (e.g., a particular job). Then they access medical databases and records to collect their data. After identifying their subjects and obtaining the medical information, they can immediately analyze the data, comparing the outcomes for those with and without exposure.
Learn more about Cohort Studies .
Case-Control Studies
Case-control designs are generally retrospective studies. Like their cohort counterparts, case-control studies compare two groups of people, those with and without a condition. These designs both assess risk and protective factors.
Retrospective cohort and case-control studies are similar but generally have differing goals. Cohort designs typically assess known risk factors and how they affect outcomes at different times. Case-control studies evaluate a particular incident, and it is an exploratory design to identify potential risk factors.
For example, a case-control assessment might evaluate an episode of severe illness occurring after a company picnic to identify potential food culprits.
Learn more about Case-Control Studies .
Advantages of a Retrospective Study
A retrospective study tends to have the following advantages compared to a prospective design:
Cheaper : You don’t need a lab or equipment to measure information. Others did that for you!
Faster : The events have already occurred in a retrospective study—no need to wait for them to happen and then look for the differences between the groups.
Great for rare diseases : You can specifically look through a database for individuals with a rare disease or condition. In a prospective experiment, you need an immense sample size and hope enough of the rare outcomes occur for you to analyze.
Disadvantages of a Retrospective Study
Unfortunately, they tend to have the following disadvantages relating to a greater propensity for inaccuracies, inconsistencies, lack of controlled conditions, and bias:
- A retrospective study uses data measured for other purposes.
- Different people, procedures, and equipment might have recorded the data, leading to inconsistencies.
- Measurements might have occurred under differing conditions.
- Control variables might not be measured, leading to confounding.
- Recall bias.
Dean R Hess, Retrospective Studies and Chart Reviews , Respiratory Care , October 2004, 49 (10) 1171-1174.
Share this:

Reader Interactions

November 7, 2022 at 8:26 am
Coincidentally, I just read this Israeli retrospective cohort study regarding the incidence of myocarditis and pericarditis in unvaxxed post-COVID-19 patients: https://pubmed.ncbi.nlm.nih.gov/35456309/
Good news for a change.
Comments and Questions Cancel reply
- En español – ExME
- Em português – EME
Case-control and Cohort studies: A brief overview
Posted on 6th December 2017 by Saul Crandon

Introduction
Case-control and cohort studies are observational studies that lie near the middle of the hierarchy of evidence . These types of studies, along with randomised controlled trials, constitute analytical studies, whereas case reports and case series define descriptive studies (1). Although these studies are not ranked as highly as randomised controlled trials, they can provide strong evidence if designed appropriately.
Case-control studies
Case-control studies are retrospective. They clearly define two groups at the start: one with the outcome/disease and one without the outcome/disease. They look back to assess whether there is a statistically significant difference in the rates of exposure to a defined risk factor between the groups. See Figure 1 for a pictorial representation of a case-control study design. This can suggest associations between the risk factor and development of the disease in question, although no definitive causality can be drawn. The main outcome measure in case-control studies is odds ratio (OR) .
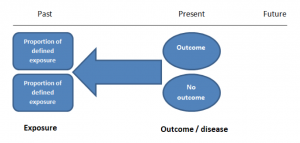
Figure 1. Case-control study design.
Cases should be selected based on objective inclusion and exclusion criteria from a reliable source such as a disease registry. An inherent issue with selecting cases is that a certain proportion of those with the disease would not have a formal diagnosis, may not present for medical care, may be misdiagnosed or may have died before getting a diagnosis. Regardless of how the cases are selected, they should be representative of the broader disease population that you are investigating to ensure generalisability.
Case-control studies should include two groups that are identical EXCEPT for their outcome / disease status.
As such, controls should also be selected carefully. It is possible to match controls to the cases selected on the basis of various factors (e.g. age, sex) to ensure these do not confound the study results. It may even increase statistical power and study precision by choosing up to three or four controls per case (2).
Case-controls can provide fast results and they are cheaper to perform than most other studies. The fact that the analysis is retrospective, allows rare diseases or diseases with long latency periods to be investigated. Furthermore, you can assess multiple exposures to get a better understanding of possible risk factors for the defined outcome / disease.
Nevertheless, as case-controls are retrospective, they are more prone to bias. One of the main examples is recall bias. Often case-control studies require the participants to self-report their exposure to a certain factor. Recall bias is the systematic difference in how the two groups may recall past events e.g. in a study investigating stillbirth, a mother who experienced this may recall the possible contributing factors a lot more vividly than a mother who had a healthy birth.
A summary of the pros and cons of case-control studies are provided in Table 1.
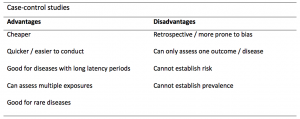
Table 1. Advantages and disadvantages of case-control studies.
Cohort studies
Cohort studies can be retrospective or prospective. Retrospective cohort studies are NOT the same as case-control studies.
In retrospective cohort studies, the exposure and outcomes have already happened. They are usually conducted on data that already exists (from prospective studies) and the exposures are defined before looking at the existing outcome data to see whether exposure to a risk factor is associated with a statistically significant difference in the outcome development rate.
Prospective cohort studies are more common. People are recruited into cohort studies regardless of their exposure or outcome status. This is one of their important strengths. People are often recruited because of their geographical area or occupation, for example, and researchers can then measure and analyse a range of exposures and outcomes.
The study then follows these participants for a defined period to assess the proportion that develop the outcome/disease of interest. See Figure 2 for a pictorial representation of a cohort study design. Therefore, cohort studies are good for assessing prognosis, risk factors and harm. The outcome measure in cohort studies is usually a risk ratio / relative risk (RR).
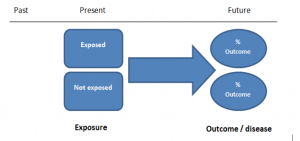
Figure 2. Cohort study design.
Cohort studies should include two groups that are identical EXCEPT for their exposure status.
As a result, both exposed and unexposed groups should be recruited from the same source population. Another important consideration is attrition. If a significant number of participants are not followed up (lost, death, dropped out) then this may impact the validity of the study. Not only does it decrease the study’s power, but there may be attrition bias – a significant difference between the groups of those that did not complete the study.
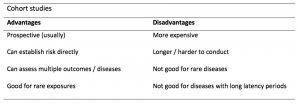
Cohort studies can assess a range of outcomes allowing an exposure to be rigorously assessed for its impact in developing disease. Additionally, they are good for rare exposures, e.g. contact with a chemical radiation blast.
Whilst cohort studies are useful, they can be expensive and time-consuming, especially if a long follow-up period is chosen or the disease itself is rare or has a long latency.
A summary of the pros and cons of cohort studies are provided in Table 2.
The Strengthening of Reporting of Observational Studies in Epidemiology Statement (STROBE)
STROBE provides a checklist of important steps for conducting these types of studies, as well as acting as best-practice reporting guidelines (3). Both case-control and cohort studies are observational, with varying advantages and disadvantages. However, the most important factor to the quality of evidence these studies provide, is their methodological quality.
- Song, J. and Chung, K. Observational Studies: Cohort and Case-Control Studies . Plastic and Reconstructive Surgery.  2010 Dec;126(6):2234-2242.
- Ury HK. Efficiency of case-control studies with multiple controls per case: Continuous or dichotomous data . Biometrics . 1975 Sep;31(3):643–649.
- von Elm E, Altman DG, Egger M, Pocock SJ, Gøtzsche PC, Vandenbroucke JP; STROBE Initiative. The Strengthening the Reporting of Observational Studies in Epidemiology (STROBE) statement: guidelines for reporting observational studies.  Lancet 2007 Oct;370(9596):1453-14577. PMID: 18064739.

Saul Crandon
Leave a reply cancel reply.
Your email address will not be published. Required fields are marked *
Save my name, email, and website in this browser for the next time I comment.
No Comments on Case-control and Cohort studies: A brief overview

Very well presented, excellent clarifications. Has put me right back into class, literally!

Very clear and informative! Thank you.

very informative article.

Thank you for the easy to understand blog in cohort studies. I want to follow a group of people with and without a disease to see what health outcomes occurs to them in future such as hospitalisations, diagnoses, procedures etc, as I have many health outcomes to consider, my questions is how to make sure these outcomes has not occurred before the “exposure disease”. As, in cohort studies we are looking at incidence (new) cases, so if an outcome have occurred before the exposure, I can leave them out of the analysis. But because I am not looking at a single outcome which can be checked easily and if happened before exposure can be left out. I have EHR data, so all the exposure and outcome have occurred. my aim is to check the rates of different health outcomes between the exposed)dementia) and unexposed(non-dementia) individuals.

Very helpful information

Thanks for making this subject student friendly and easier to understand. A great help.

Thanks a lot. It really helped me to understand the topic. I am taking epidemiology class this winter, and your paper really saved me.
Happy new year.

Wow its amazing n simple way of briefing ,which i was enjoyed to learn this.its very easy n quick to pick ideas .. Thanks n stay connected

Saul you absolute melt! Really good work man

am a student of public health. This information is simple and well presented to the point. Thank you so much.

very helpful information provided here

really thanks for wonderful information because i doing my bachelor degree research by survival model

Quite informative thank you so much for the info please continue posting. An mph student with Africa university Zimbabwe.

Thank you this was so helpful amazing

Apreciated the information provided above.

So clear and perfect. The language is simple and superb.I am recommending this to all budding epidemiology students. Thanks a lot.

Great to hear, thank you AJ!

I have recently completed an investigational study where evidence of phlebitis was determined in a control cohort by data mining from electronic medical records. We then introduced an intervention in an attempt to reduce incidence of phlebitis in a second cohort. Again, results were determined by data mining. This was an expedited study, so there subjects were enrolled in a specific cohort based on date(s) of the drug infused. How do I define this study? Thanks so much.

thanks for the information and knowledge about observational studies. am a masters student in public health/epidemilogy of the faculty of medicines and pharmaceutical sciences , University of Dschang. this information is very explicit and straight to the point

Very much helpful
Subscribe to our newsletter
You will receive our monthly newsletter and free access to Trip Premium.
Related Articles

Cluster Randomized Trials: Concepts
This blog summarizes the concepts of cluster randomization, and the logistical and statistical considerations while designing a cluster randomized controlled trial.

Expertise-based Randomized Controlled Trials
This blog summarizes the concepts of Expertise-based randomized controlled trials with a focus on the advantages and challenges associated with this type of study.

An introduction to different types of study design
Conducting successful research requires choosing the appropriate study design. This article describes the most common types of designs conducted by researchers.
Design of Retrospective and Case-Control Studies in Oncology
- First Online: 17 April 2018
Cite this chapter

- Katherine S. Panageas Dr.P.H. 3 ,
- Debra A. Goldman M.S. 3 &
- T. Peter Kingham M.D. 4
1752 Accesses
Retrospective studies allow researchers to evaluate outcomes in a real-world setting at reduced costs compared with prospective trials, and have long-established use in surgical oncology. In retrospective studies, the study sample is generated from secondary or pre-existing data, which precludes randomization. As a result, the potential for unique and significant biases exists and these can limit the applicability and generalizability of the findings. This chapter is intended to serve as a guide for conducting retrospective research studies. Topics covered include internal and external validity; types of biases; sampling and matching techniques, including propensity score matching; missing data; and special considerations for common study designs. Examples from the surgical oncology literature are provided.
This is a preview of subscription content, log in via an institution to check access.
Access this chapter
Subscribe and save.
- Get 10 units per month
- Download Article/Chapter or eBook
- 1 Unit = 1 Article or 1 Chapter
- Cancel anytime
- Available as PDF
- Read on any device
- Instant download
- Own it forever
- Available as EPUB and PDF
- Compact, lightweight edition
- Dispatched in 3 to 5 business days
- Free shipping worldwide - see info
- Durable hardcover edition
Tax calculation will be finalised at checkout
Purchases are for personal use only
Institutional subscriptions
Strengths and Limitations of Registries in Surgical Oncology Research

What can we learn from oncology surgical trials?

Pediatric Oncology Surgery: Research Methodology
Gay J. Clinical study design and methods terminology. 2010. http://people.vetmed.wsu.edu/jmgay/courses/glossclinstudy.htm . Accessed 1 May 2017.
Porter GA, Skibber JM. Outcomes research in surgical oncology. Ann Surg Oncol. 2000;7(5):367–75.
Article CAS PubMed Google Scholar
Funai EF, Rosenbush EJ, Lee MJ, Del Priore G. Distribution of study designs in four major US journals of obstetrics and gynecology. Gynecol Obstet Investig. 2001;51(1):8–11.
Article CAS Google Scholar
Scales CD Jr, Norris RD, Peterson BL, Preminger GM, Dahm P. Clinical research and statistical methods in the urology literature. J Urol. 2005;174(4, Part 1):1374–9.
Article PubMed Google Scholar
Solomon MJ, McLeod RS. Surgery and the randomised controlled trial: past, present and future. Med J Aust. 1998;169(7):380–3.
PubMed CAS Google Scholar
Kærn J, Tropé CG, Abeler VM. A retrospective study of 370 borderline tumors of the ovary treated at the Norwegian Radium Hospital from 1970 to 1982. A review of clinicopathologic features and treatment modalities. Cancer. 1993;71(5):1810–20.
Sartwell PE. Retrospective studies: a review for the clinician. Ann Intern Med. 1974;81(3):381–6.
Van den Beuken-van Everdingen M, De Rijke J, Kessels A, Schouten H, Van Kleef M, Patijn J. Prevalence of pain in patients with cancer: a systematic review of the past 40 years. Ann Oncol. 2007;18(9):1437–49.
Markman M. A unique role for retrospective studies in clinical oncology. Oncology. 2014;86(5-6):350.
Hayden GF, Kramer MS, Horwitz RI. The case-control study. A practical review for the clinician. JAMA. 1982;247(3):326–31.
Grimes DA, Schulz KF. An overview of clinical research: the lay of the land. Lancet. 2002;359(9300):57–61.
Sauerland S, Lefering R, Neugebauer E. Retrospective clinical studies in surgery: potentials and pitfalls. J Hand Surg. 2002;27(2):117–21.
The Cochrane Collaboration. Glossary. 2017. http://community-archive.cochrane.org/glossary/5#letterv . Accessed 1 May 2017.
Rochon PA, Gurwitz JH, Sykora K, Mamdani M, Streiner DL, Garfinkel S, Normand S-LT, Geoffrey M. Reader's guide to critical appraisal of cohort studies: 1. Role and design. BMJ. 2005;330(7496):895.
Article PubMed PubMed Central Google Scholar
Cook TD, Campbell DT. The design and conduct of quasi-experiments and true experiments in field settings. In: Dunnette MD, editor. Handbook of industrial and organizational psychology, vol. 223. Amsterdam: Elsevier; 1976. p. 336.
Google Scholar
Steckler A, McLeroy KR. The importance of external validity. Am J Public Health. 2008;98(1):9–10.
Ademuyiwa FO, Edge SB, Erwin DO, Orom H, Ambrosone CB, Underwood W. Breast cancer racial disparities: unanswered questions. Cancer Res. 2011;71(3):640–4.
Albain KS, Unger JM, Crowley JJ, Coltman CA, Hershman DL. Racial disparities in cancer survival among randomized clinical trials patients of the Southwest Oncology Group. J Natl Cancer Inst. 2009;101(14):984–92.
Du XL, Fang S, Vernon SW, El-Serag H, Shih YT, Davila J, Rasmus ML. Racial disparities and socioeconomic status in association with survival in a large population-based cohort of elderly patients with colon cancer. Cancer. 2007;110(3):660–9.
York RO. Conducting social work research: an experiential approach. London: Pearson College Division; 1998.
Aschengrau A, Seage GR. Essentials of epidemiology in public health. Burlington, MA: Jones & Bartlett Learning, LLC; 2013.
Weiss NS. Clinical epidemiology: the study of the outcome of illness. Oxford: Oxford University Press; 1996.
Coughlin SS. Recall bias in epidemiologic studies. J Clin Epidemiol. 1990;43(1):87–91.
Damon A, Bajema CJ. Age at menarche: accuracy of recall after thirty-nine years. Hum Biol. 1974;46:381–4.
Lowe JT, Li X, Fasulo SM, Testa EJ, Jawa A. Patients recall worse preoperative pain after shoulder arthroplasty than originally reported: a study of recall accuracy using the American Shoulder and Elbow Surgeons score. J Shoulder Elb Surg. 2017;26(3):506–11.
Article Google Scholar
Schatman ME, Campbell A, Loeser JD. Chronic pain management: guidelines for multidisciplinary program development. Boca Raton, FL: CRC Press; 2007.
Cochran WG, Rubin DB. Controlling bias in observational studies: a review. Sankhyā. 1973;35:417–46.
Austin PC. Optimal caliper widths for propensity-score matching when estimating differences in means and differences in proportions in observational studies. Pharm Stat. 2011;10(2):150–61.
Austin PC. A critical appraisal of propensity-score matching in the medical literature between 1996 and 2003. Stat Med. 2008;27(12):2037–49.
Rosenbaum PR, Rubin DB. The central role of the propensity score in observational studies for causal effects. Biometrika. 1983;70:41–55.
Rosenbaum PR, Rubin DB. Reducing bias in observational studies using subclassification on the propensity score. J Am Stat Assoc. 1984;79(387):516–24.
Austin PC. An introduction to propensity score methods for reducing the effects of confounding in observational studies. Multivariate Behav Res. 2011;46(3):399–424.
Amar D, Zhang H, Pedoto A, Desiderio DP, Shi W, Tan KS. Protective lung ventilation and morbidity after pulmonary resection: a propensity score-matched analysis. Anesth Analg. 2017;125(1):190–9.
Gu XS, Rosenbaum PR. Comparison of multivariate matching methods: structures, distances, and algorithms. J Comput Graph Stat. 1993;2(4):405–20.
Burton A, Altman DG. Missing covariate data within cancer prognostic studies: a review of current reporting and proposed guidelines. Br J Cancer. 2004;91(1):4–8.
Article CAS PubMed PubMed Central Google Scholar
Pedersen AB, Mikkelsen EM, Cronin-Fenton D, Kristensen NR, Pham TM, Pedersen L, Petersen I. Missing data and multiple imputation in clinical epidemiological research. Clin Epidemiol. 2017;9:157–66.
Anderson JR, Cain KC, Gelber RD. Analysis of survival by tumor response. J Clin Oncol. 1983;1(11):710–9.
Download references
Author information
Authors and affiliations.
Department of Epidemiology and Biostatistics, Memorial Sloan Kettering Cancer Center, New York, NY, USA
Katherine S. Panageas Dr.P.H. & Debra A. Goldman M.S.
Department of Surgery, Memorial Sloan Kettering Cancer Center, New York, NY, USA
T. Peter Kingham M.D.
You can also search for this author in PubMed Google Scholar
Corresponding author
Correspondence to T. Peter Kingham M.D. .
Editor information
Editors and affiliations.
Hospital do Câncer de Barretos, Barretos, São Paulo, Brazil
Raphael. L.C Araújo
AC Camargo Cancer Center, Dir - Brazil Gastrointestinal Tumor Grup, São Paulo, São Paulo, Brazil
Rachel P. Riechelmann
Rights and permissions
Reprints and permissions
Copyright information
© 2018 Springer International Publishing AG, part of Springer Nature
About this chapter
Panageas, K.S., Goldman, D.A., Kingham, T.P. (2018). Design of Retrospective and Case-Control Studies in Oncology. In: Araújo, R., Riechelmann, R. (eds) Methods and Biostatistics in Oncology. Springer, Cham. https://doi.org/10.1007/978-3-319-71324-3_9
Download citation
DOI : https://doi.org/10.1007/978-3-319-71324-3_9
Published : 17 April 2018
Publisher Name : Springer, Cham
Print ISBN : 978-3-319-71323-6
Online ISBN : 978-3-319-71324-3
eBook Packages : Medicine Medicine (R0)
Share this chapter
Anyone you share the following link with will be able to read this content:
Sorry, a shareable link is not currently available for this article.
Provided by the Springer Nature SharedIt content-sharing initiative
- Publish with us
Policies and ethics
- Find a journal
- Track your research
- Search Menu
- Sign in through your institution
- Advance articles
- Author Guidelines
- Submission Site
- Open Access
- About Biostatistics
- Editorial Board
- Advertising and Corporate Services
- Journals Career Network
- Self-Archiving Policy
- Dispatch Dates
- Journals on Oxford Academic
- Books on Oxford Academic
Article Contents
1. i ntroduction, 2. m otivating examples, 3. k ey concepts, 4. t he bias breaking model, 4.1. conditional versus marginal estimators, 4.2. additional data sources, 4.3. adjusted estimators, 5. s imulations, 6. a pplication, 7. r elated methods, 8. d iscussion.
- < Previous
Adjusting for selection bias in retrospective, case–control studies
- Article contents
- Figures & tables
- Supplementary Data
Sara Geneletti, Sylvia Richardson, Nicky Best, Adjusting for selection bias in retrospective, case–control studies, Biostatistics , Volume 10, Issue 1, January 2009, Pages 17–31, https://doi.org/10.1093/biostatistics/kxn010
- Permissions Icon Permissions
Retrospective case–control studies are more susceptible to selection bias than other epidemiologic studies as by design they require that both cases and controls are representative of the same population. However, as cases and control recruitment processes are often different, it is not always obvious that the necessary exchangeability conditions hold. Selection bias typically arises when the selection criteria are associated with the risk factor under investigation. We develop a method which produces bias-adjusted estimates for the odds ratio. Our method hinges on 2 conditions. The first is that a variable that separates the risk factor from the selection criteria can be identified. This is termed the “bias breaking” variable. The second condition is that data can be found such that a bias-corrected estimate of the distribution of the bias breaking variable can be obtained. We show by means of a set of examples that such bias breaking variables are not uncommon in epidemiologic settings. We demonstrate using simulations that the estimates of the odds ratios produced by our method are consistently closer to the true odds ratio than standard odds ratio estimates using logistic regression. Further, by applying it to a case–control study, we show that our method can help to determine whether selection bias is present and thus confirm the validity of study conclusions when no evidence of selection bias can be found.
In epidemiology, observational studies are used to investigate the association between a set of risk factors and one or several health outcomes. To interpret their results, it is crucial to bear in mind the range of potential biases which might compromise inference ( Greenland, 2005 ). These biases fall broadly into 3 categories, biases related to the selection of subjects into the study, biases arising from the way in which the data are apprehended (e.g. recall bias, truncation bias, measurement error) and finally bias due to confounding.
Retrospective case–control studies are by design more prone to selection bias than other epidemiologic studies. To be interpretable, they require that both cases and controls are representative of the same “target population.” However, typically cases are identified either through a hospital or through a specialized registry, while controls are recruited by a complex process which involves among other things identifying the target population. The problem is compounded further by “self-selection” as participation of both cases and controls is voluntary. Thus, it is not always clear whether the study population forms a representative sample of the target population and whether the necessary exchangeability conditions between cases and controls hold.
In many cases, selection bias is not extreme enough to have an impact on inference and conclusions. However, there are circumstances under which even the best designed and run study is jeopardized by selection bias. Mezei and Kheifets (2006) show that selection bias in case–control studies can lead to overestimating the true odds ratio by up to a factor of 2. If selection bias is suspected, there are circumstances under which it is possible to attempt to adjust for it. The aim of this paper is to address these issues for retrospective case–control studies. However, the methods developed can be adapted to other types of studies investigating exposure—disease associations or even to survey-based studies.
Formally, selection bias occurs when the association between exposure and outcome within the study population is different from that in the target population. Selection problems range from identifying the representative sample to recruiting it and following it up. Further, selection bias can be introduced into a study at the design stage or during implementation.
In most epidemiologic papers analyzing case–control data, selection bias is addressed in the discussion; however, assessment generally remains qualitative. This paper details how we can detect and adjust for selection bias. The method requires first that a variable (or set of variables) that is highly associated with the selection criteria and hence with the biasing process can be identified. We term this the “bias breaking” variable. Second, potential bias breaking variables must be such that their distribution can be estimated from data that are not biased, and thus additional data are necessary. Despite these stringent requirements, we demonstrate using some examples that bias breaking variables are not uncommon.
The conditions for a variable to be bias breaking are formulated in terms of conditional independences and represented by directed acyclic graphs (DAGs). First, we express selection bias in a unique way in terms of DAGs, parallelling ( Hernan and others , 2004 ). Then, we set up a formal framework in which it is easy to determine under what circumstances it is possible to adjust for selection bias using a bias breaking variable.
In Section 2, we motivate the paper by means of some examples of selection bias in case–control studies. In Section 3, we introduce basic DAG and conditional independence concepts. In Section 4, we describe the idea of the bias breaking variable before formally developing the estimators that adjust for selection bias. Section 5 briefly describes the simulation studies we conducted to evaluate the performance of our methods. In Section 6, we apply the estimators to a case–control study investigating the association between a congenital malformation (Hypospadias) and various risk factors. Section 7 relates the methods we have developed to post-stratification (PS) and inverse probability weighting (IPW). In Section 8, we make some concluding remarks and point to future work.
2.1 E XAMPLE
Hospitalization bias, also known as Berkson's bias, has been extensively studied in the epidemiologic literature ( Schwartzbaum and others , 2003 ). This type of bias arises when the exposure is a medical condition and hence also a reason for hospitalization and only hospital-based controls are used. If the rates of hospitalization for the 3 medical conditions (cases, exposure, and control selection criteria) are different, a spurious association can be estimated between the exposure and the disease (see Kleinbaum and others , 1982 , for example).
2.2 E XAMPLE
In 1978, a controversy was sparked by Horwitz and Feinstein (1978) who claimed that case–control studies that had found an association between oestrogen use and endometrial cancer were dramatically overestimating the effects of oestrogen use. They suspected case selection bias, due to the fact that the cases were mostly women who had been diagnosed with endometrial cancer after they had gone to the doctor as a consequence of vaginal bleeding. As vaginal bleeding was a symptom of oestrogen use, women who took oestrogen could be overrepresented, thus inducing a spurious association between oestrogen use and endometrial cancer. The controversy was eventually decided in favor of the effect of oestrogen use. However, this showed that selection bias can affect case as well as control selection.
2.3 E XAMPLE
A typical problem in population-based case–control studies is that control selection is biased by the socioeconomic status (SES) of the controls. It is often found that controls with higher SES are more likely to respond than those with lower SES. Mezei and Kheifets (2006) , henceforth MK, consider a situation where there is differential selection of cases and controls in different SES levels. In a meta-analysis of studies investigating the relationship between childhood leukemia and exposure to magnetic fields (EMF), MK noticed that in studies where a questionnaire and a home measurement of EMF levels were required, the participants that allowed a home measurement were usually those with higher SES, and hence those with potentially lower EMF readings since more affluent individuals are less likely to live close to sources of EMF, such as overhead power lines, than those with low SES. Case selection bias associated with levels of SES is less likely to be a problem as, typically, cases are eager to participate. Hatch and others (2000) investigate the possibility of bias due to selection in childhood leukemia and EMF studies, using the complete data with logistic regression methods. They find some bias due to differential selection.
From the examples described above, we see that selection bias can occur in the design stage of a study (Examples 2.1 and 2.2) or in the data-gathering stage (Example 2.3). However, in retrospective case–control studies, adjustment for selection bias can only be made during the analysis.
The problem of selection bias can be seen as a problem of exchangeability. Essentially, the case and control populations cannot be assumed to be drawn from the same (target) population. Thus, they are not exchangeable conditional on their case/control status and the underlying distribution of the exposure is not the same in the study and target populations. In the case of hospitalization bias (Example 2.1), the different rates of hospital admission of cases and controls makes them nonexchangeable with the target population. In Example 2.2, the study population has a different distribution of vaginal bleeding, and hence oestrogen use than the target population. Finally, the study and base populations in Example 2.3 have different distributions of SES and hence potentially different exposure to EMF.
In this section, we describe selection bias in terms of conditional independences and DAGs. The DAG framework provides an intuitive context in which to express selection bias in case–control studies and determine potential sources. First, we introduce the machinery and the concepts required.
For the remainder of the paper, unless otherwise specified, the variable for the exposure is denoted by W and the disease or outcome by Y . Both are assumed to be binary. The variable representing whether a unit is selected into, or participates in, a case–control study is denoted by S and is also binary.
3.1. Selection bias in terms of DAGs
In order to understand how selection bias can be expressed in terms of conditional independences in a DAG, consider Examples 2.1–2.3, represented by DAGs in Figures 1 (a–d).
(a) DAG representing selection bias without exposure and disease association, (b–d) DAGs with selection bias when exposure and disease are associated.
In Example 2.2, the exposure and the disease are associated. However, this association is distorted because the selection criteria favor women who have vaginal bleeding ( B ), a symptom of oestrogen use ( W ). Depending on whether vaginal bleeding is (i) not associated with endometrial cancer or (ii) associated with endometrial cancer (for instance it might be symptom), we have 2 ways of encoding the problem in terms of conditional independences. If (i), then
One of the 3 possible DAGs encoding ( 3.3 ) and ( 3.4 ) is shown in Figure 1(b) . If (ii) is the case, then only conditional independence statement ( 3.4 ) holds and (some) associated DAGs are given in Figures 1(c) and (d) . These 2 DAGs are said to be “Markov equivalent.”
Consider Example 2.3, where the exposure and the disease are again associated, but the SES B is associated with selection and is also a potential confounder. The conditional independence that describes this scenario is again ( 3.4 ) with associated DAGs in Figures 1(c) and (d) . However, the role of B is different in the 2 examples. The 2 scenarios can only be distinguished from one another by introducing an additional variable ( Dawid, 2002 ; Geneletti, 2005 , 2006 ) such as an intervention on the exposure W .
All the DAGs in Figure 1 have a common element, namely, that there is a v-structure from W and Y to S when we “collapse” over the remaining variables. This is the key feature in selection bias formalized in Section 3.2. DAGs that are Markov equivalent to those we consider above are given in Section 4 of the supplementary material, available at Biostatistics online.
3.2. Odds ratios
The basic idea behind the bias breaking model is as follows: Suppose that a case–control study is suffering from selection bias because the selection criteria are associated with the exposure. However, the 2 are not associated in an obvious way, otherwise this could have been take into account when planning the study. Rather, there is a variable (or set of variables) associated with the exposure that is influencing the selection rates in a way that is either impossible to control for (such as self-selection) or unexpected. If this variable is such that it somehow “separates” the exposure from the selection criteria, then under certain circumstances detailed below, we can adjust for selection bias. This variable is termed the bias breaking variable and denoted by B .
For the sake of simplicity, we concentrate on the situations where there is an association between the exposure W and the disease Y . However, the estimators developed in Section 4.3 can be used to adjust for selection bias whether or not there is an association, as we show by simulation in Section 5. We also assume that the bias breaker B is discrete or, if it is continuous, can be appropriately stratified.
4.1 A SSUMPTION
Case and control selection are independent processes and thus can be treated separately.
This is usually plausible as cases and controls are recruited in different ways. The concept of “separation” can be formalized in terms of conditional independences and is the second assumption on which the bias breaking model is based.
4.2 A SSUMPTION
Note that based on the assumption in ( 4.1 ) only, B is a confounder for the effect of W on Y . If B is not a confounder, then ( 3.3 ) holds as well. Finally, we require the following assumption.
4.3 A SSUMPTION
The bias breaker, B , is such that additional data are available, so that we can obtain a bias-corrected estimate of its distribution, p ( B = i | Y = y ).
This is a necessary assumption, as in order to estimate p ( B = i | Y = y ), we need data that are not subject to selection bias. Thus, additional data must be found. These can be other data gathered within the study that contain appropriate “partial information” on B (see Section 4.2 below) or data that are external to the study itself.
Although we only consider B discrete above, the setup can be extended to consider a continuous B , where p ( W | Y , S =1, B ) is a continuous function of B . We then need to estimate the density of B conditional on Y .
Note that once we have an adjusted estimate of π y , we can compare this to the naive estimate p ( W =1| Y = y , S =1) which uses only the study data itself. If these are significantly different, there is evidence of selection bias mediated by B .
When the disease under investigation is rare, as in Example 2.3, and there is only control but not case selection bias, then often the marginal distribution p ( B = i ) is a good approximation to the conditional distribution p ( B = i | Y =0) required in (4.3).
4.4 E XAMPLE
In Example 2.1, selection bias comes about because controls are selected among people who have been hospitalized for one or more medical conditions ( C ), generally chosen to be unrelated to the disease under investigation ( Y ). The bias breaking variable in this situation is therefore the hospitalization H given the condition C . Thus, we must estimate p ( H , C | Y ) to adjust for selection bias. When the disease is rare, we can approximate p ( H , C | Y =0) with p ( H , C ), the population rather than control distribution. The additional data needed to do this can be found in large government databases. In the United Kingdom, there are 2 such sources: the Hospital Episode Statistics database and the Health Survey for England.
4.5 E XAMPLE
In Example 2.2, the problem is one of case selection and the bias breaking variable is vaginal bleeding V . The probability needed to adjust for bias is p ( V | Y =1), which can be estimated by the proportion of women (in the population) with endometrial cancer who experience vaginal bleeding. As endometrial cancer is such that almost all women with the condition are eventually identified, additional data in the form of registry and medical records can be used to get a handle on p ( V | Y =1). These data are external to the study itself.
4.6 E XAMPLE
Consider the studies on the association of childhood leukemia and EMF in Example 2.3. In most studies (see Mezei and Kheifets, 2006 ), analysis is conducted using only data on “full” participants, that is, those who completed detailed questionnaires and allowed magnetic field measurements (the exposure of interest) within their homes. The partial participants who only completed the questionnaire are excluded. Selection bias is suspected to enter these studies precisely because people with lower SES are less likely to allow measurements within their homes. If we assume that SES is the bias breaker B and pool the SES data from the questionnaires of the full and partial participants, we can obtain an estimate of B ‘s distribution among controls p ( B | Y =0). In this situation, the additional data have been collected as part of the study itself. In Section 6, we fully develop a similar example.
Examples 4.4 and 4.5 above are examples of “evidence synthesis” (Ades and Sutton, 2006). This term is used to describe analyses where information from different sources is combined to make better inference. When combining data to adjust for selection bias using a bias breaking variable, it is necessary to carefully assess whether synthesis is appropriate.
In this section, we present our proposed selection bias-adjusted estimators. We look at both conditional estimators based on ( 4.3 ) and marginal estimators based on ( 4.4 ). The estimates of the distribution of the bias breaker can be seen as weighting the study estimates by the stratum-specific exposure probabilities.
We also need to distinguish between different sources of additional data. We focus on 2 types. The first is partial participant data which we term internal data. The second is data that are external to the study itself such as census data termed external data. We mention both types in Example 4.6 above.
In the internal case, we observe the columns C1–C4 of the table below in each stratum i of B as well as the respective totals over strata of B in columns C5 and C6. In the external case, we observe columns C1–C3 as well as C5 and C7 of the table below in each stratum of B and the respective totals over strata of B in column C8.
| C1 | C2 | C3 | C4 | C5 | C6 | C7 | C8 | ||
| = 0 | = 1 | Full study | Partial | Study Total | Part Total | External | Ext Total | ||
| 0 | |||||||||
| 1 | |||||||||
| Totals |
The types of adjusted estimators of p ( B | Y ) with examples
| Estimator | Example | |
| Conditional internal | (4.7) | Example 4.6 where the additional data are data on the partial participants and we do not want to assume that ( | ) ≈ ( ). |
| Conditional external | (4.8) | Example 4.5. In this situation, we know the case status of the patients from the cancer registries or medical records, and these data are external to the study itself. |
| Marginal internal | (4.9) | Example 4.6 if the control study data + are sparse. In this case, we can combine the SES data on all the participants (both cases and controls) to obtain a less variable estimate. |
| Marginal external | (4.10) | Example 4.4 where we make use of the large government databases and we do not know the case/control status of the individuals in the database. |
We have thus derived a series of estimators which depend on the type of additional data that are available, and on the assumptions we are willing to make about the source and nature of the selection bias. However, this list is by no means exhaustive. Other estimators can be developed to suit individual contexts by using the machinery we have developed. Further, if the bias breaking variable is in fact a set of variables, the method can be extended in the obvious way.
The aim of the simulations detailed below is to create case–control study data sets with selection bias to study the performance of our adjusted estimators. We ran 2 types of simulation studies, both based loosely on Example A in MK. In this example, MK showed that in a population with no association between the disease and the exposure (i.e. OR TRUE =1) divided into 3 SES groups such that 20%, 60%, and 20% are in the high, medium, and low SES groups, respectively, varying the exposure and selection probabilities of the low SES group suffices to bias the estimate of the odds ratios up to 1.6.
In both simulation studies, we considered the simple case (i) where there is no association between exposure and disease, that is, OR TRUE =1, (ii) the situation when there is an association, but the bias breaking variable is not a confounder (OR TRUE =2), and finally (iii) the case when the bias breaking variable is also a confounder (OR TRUE =2.41). We chose an odds ratio of 2.41 so as to make results approximately comparable to the no-confounding scenario where OR TRUE =2. We looked at 3 biasing scenarios as well as 4 exposure probabilities for the low SES group.
Each simulation was repeated 1000 times and the reported estimates of both the means and confidence intervals are averages over the replicates. The empirical standard deviation of simulation results ranges from 0.015 for the marginal external estimator (which used the most data) to 0.021 for the internal conditional estimator (which used the least data). For OR TRUE =2.41 in the highest selection bias situation, at least 81% of the 95% confidence intervals (computed using the variance formulae in supplementary material Section 1, available at Biostatistics online) contained the true odds ratio; in the lowest selection bias scenario, this was as high as 96%. Additional details of the simulation study are given in Section 2 of the supplementary material, available at Biostatistics online. The most relevant results are shown and discussed in Section 5.1 below.
5.1. Results
Figure 2 shows the results for both simulation studies when the exposure probability is highest in the most deprived group, which leads to the most selection bias. The plot on the left-hand side of Figure 2 shows the difference between estimators and the true odds ratio on the log scale, when OR TRUE =2 in study 1, whereas the right-hand side of Figure 2 shows the differences for OR TRUE =2.41 in study 2. Selection bias increases from left to right. In both cases, the naive estimates increase, the benchmark estimate is stable, and the adjusted estimators outperform both naive estimates. These results are typical of all scenarios in both simulation studies.
Table 2 shows the odds ratio and 95% confidence interval estimates for the most extreme biasing case for all 3 odds ratios considered. The point estimates of the best adjusted estimates perform better than those of the best standard estimate. Similar results hold for the other biasing situations.
Best adjusted estimators for the most extreme bias situation ( p ( W = 1| B = 3) = 0.16) for all odds ratios in both simulation studies. The confidence intervals were based on an approximation to the variances derived in Section 1 of the supplementary material, available at Biostatistics online
| OR | Estimator | Simulation study 1 | Simulation study 2 | ||
| 95% CI | 95% CI | ||||
| 1 | Best adjusted ( ) | 1.02 | (0.45, 2.30) | 1.03 | (0.47, 2.27) |
| Best standard ( ) | 1.23 | (0.63, 2.37) | 1.22 | (0.64, 2.32) | |
| 2 | Best adjusted ( ) | 2.09 | (0.95, 4.59) | 2.04 | (0.90, 4.65) |
| Best standard ( ) | 2.54 | (1.40, 4.62) | 2.52 | (1.38, 4.57) | |
| 2.41 | Best adjusted ( ) | 2.73 | (1.23, 6.04) | 2.76 | (1.26, 6.05) |
| Best standard ( ) | 3.28 | (1.85, 4.93) | 3.28 | (1.83, 5.92) | |
The marginal estimators in both studies outperformed the conditional estimators because they use more data—the conditional estimator is restricted by case–control status. As study 2 is intended to emulate the situation where census data are used to adjust for selection bias, it is unlikely that the case/control status of the census individuals will be known and conditional estimators would not be used.
We derived approximate expressions for variances of the adjusted estimates (see Section 1 of the supplementary material for details, available at Biostatistics online). The approximation uses a specific conditional independence assumption. When there is selection bias as in the simulation studies, the independence does not hold and the variance is overestimated. Nevertheless, as a conservative guideline, we report the average size of the confidence intervals in Table 2 ; see Sections 6 and 8 for further discussion. Future work involves a Bayesian approach to this problem where variance estimates as developed here will not be necessary.
The application we consider is a case–control study investigating the association between Hypospadias, a minor urogenital congenital malformation affecting baby boys which is developed during gestation, and various risk factors ( Nelson, 2002 , Ormond and others , 2007 ). In the study, the average income of controls was slightly higher than that of cases. This gave rise to concern about selection bias brought about by differential enrollment into the study due to SES. We thus assume that SES is the bias breaking variable.
Women in the study were administered a questionnaire that covered a range of risk factors including occupational, lifestyle, and health-related exposures as well as confounders. We only consider the risk factors: smoking, maternal age, preterm birth, all of which have been linked to Hypospadias ( Porter and others , 2005 ). A detailed description of the data collection as well as variable codings can be found in Section 3 of the supplementary material, available at Biostatistics online.
We used 1991 ward level Carstairs score ( Carstairs and Morris, 1991 ) standardized to cover the study region as a measure of SES. The Carstairs score is an area-level index of deprivation.
Due to the nature of the data collection process, we had access to 2 sources of data. The first was the case–control study itself (see details below). The second was the population of women of childbearing age (15–49 years) in each ward in the study area taken from the 1991 census. Using these data, we were able to estimate the distribution of SES for these women. The census data are external to the study, so we use them to calculate an additional marginal estimate for the odds ratios. We discretized the Carstairs score to 3 categories: high, medium, and low.
6.1. Adjusted estimators
We consider first the estimators based on the data collected during the case–control study itself. The protocol was such that the 1991 wards of residence were known for all but a small percentage of cases. Thus, even when a case did not complete a questionnaire their Carstairs score was known. The eligible controls were contacted via their general practitioner. They could reply to the organizers and decline to participate, becoming “partial” participants as their 1991 ward of residence was known but no questionnaire was completed. If they agreed and completed a questionnaire, they became full participants, for whom both the 1991 ward was known and questionnaires obtained. Finally, they could ignore the request and become nonparticipants. Due to nonparticipation, there was the possibility of additional selection bias. However, in the first part of this analysis, we assume that the pooled sample of full and partial participants is representative. The validity of this assumption is investigated when we consider using external data sources below.
Figure 3(a) shows that the partial cases have a higher Carstairs score, and are therefore more deprived, than the other subgroups. Due to their small numbers (see supplementary material Section 3.1, available at Biostatistics online); it was unclear whether they were a representative sample. It was thus relevant to investigate the existence of selection bias mediated by SES in both cases and controls.
Figure 3(b) shows the naive and adjusted estimates based on the internal data and their 95% confidence intervals for the 3 risk factors we considered (see Section 3.2 of the supplementary material for a detailed derivation of the estimators in this context, available at Biostatistics online). There is practically no difference between the 4 estimates for any of the risk factors. This indicates that there is no selection bias mediated by SES, thus confirming the validity of the case–control study and its conclusions.
Note also that the variances of all the estimates are very similar. This is in contrast to the simulation studies where the variances of the adjusted estimates are noticeably larger than those of the standard estimates. This confirms indirectly that there is no selection bias mediated by SES. Indeed, when there is no selection bias, the conditional independence assumption which simplifies calculations of the variances does hold, and there is no overestimation.
In order to use the full and partial data estimators, we assumed that the eligible controls that participated were a representative sample of the base population of women living in the area covered by the case–control study, that is, we assumed that there was no further selection bias due to nonparticipation. This meant that the complete respondent data provided us with a good estimate of the distribution of SES.
A large divergence between the estimates would indicate that the study population is nonexchangeable in terms of SES with the population of women of childbearing age that we are using to adjust for selection bias. In the current context, this does not seem to be the case, and we must be careful not to overinterpret small differences in the estimates.
PS and IPW are common weighting procedures. The former is used principally in survey literature and is rare in epidemiology ( Samuelsen and others , 2006 ). The latter, or variants of it, are used in econometrics ( Wooldridge, 2007 ) and epidemiology ( Rotnitzky and Robins, 2005 ). Both methods are aimed at adjusting for potential biases.
PS is used to adjust for item nonresponse. PS depends on additional information being available that is external to the study. Typically, in the context of surveys, the additional data comes from a census or other administrative data and is in the form of population totals. PS estimates are mathematically analogous to the adjusted estimates proposed here, the differences being the nature of the exposures and outcomes of interest. Bayesian extensions using hierarchical models to smooth, or borrow strength, have been put forward by Gelman and Carlin (2001) and Gelman (2007) . Due to the similarity between PS and our estimators, we can easily implement the Bayesian extensions.
IPW is a weighting procedure put forward by Jamie Robins in the epidemiologic literature. In IPW methods, additional information is in the form of selection probabilities as it is generally used for dealing with drop out or censoring. Thus, the selection mechanism is known or known to be of a particular form. For this reason, IPW methods not usually appropriate in the current context.
Finally, the estimators we propose are similar to those put forward by Hellerstein and Imbens (1999) in the econometric literature to deal with situations when the sample population used to estimate parameters is not exchangeable with the target population which is of inferential interest. In order to get estimates of the target population parameters, weighting procedures based on auxiliary information are used.
In this paper, we have developed a conceptual framework for selection bias in case–control studies. By using graphical models and conditional independence statements, we were able to explore ways in which selection bias enters case–control studies and formally state suitable assumptions for estimation of odds ratios. In particular, we demonstrated how to construct a model which incorporates additional bias breaking variables to adjust for selection bias and explained how these data can be combined with study data to improve inference.
We considered a handful of plausible adjusted estimators; however, using the same principles, other estimators can be developed. When external data are sparse (e.g. when it is collected specifically to adjust for selection bias) and only control selection bias is suspected, then study case data can be combined with external control data on the bias breaker to estimate its distribution.
Using a simulation study, we showed that the estimators we have developed can be used successfully to adjust for selection bias. These estimators always outperform the standard estimators. Overall, the marginal estimators perform best because they use more data than the conditional estimators. We thus recommend using marginal estimators when possible.
We also showed, using a real data set, that the adjusted estimates can be used to check whether a potential bias breaking variable is indeed related to selection bias by comparing the adjusted to naive estimates. We note that adjusting for potential selection bias when it is not present does not introduce bias; in the application, the naive and adjusted estimators are virtually identical. This is reassuring and means that various potential bias breaking variables can be explored without compromising inference. Thus, the method can be used to validate the findings of retrospective case–control studies.
The main problem with the adjusted estimators as they stand is that they have a variance which is larger than that of the standard estimates. The explanation for this inflation of the variance is that, in order to simplify the analytic derivation of the variances, we have made a conditional independence assumption which is unlikely to hold when there is selection bias.
The next step is to develop Bayesian hierarchical models in the spirit of PS ( Gelman, 2007 ). This will have various advantages over the current approach. It will create a natural framework for sensitivity analysis. It will provide realistic variance estimates without resorting to analytic approximations. Finally, it will simplify the inclusion of additional covariates.
Economic and Social Research Council (RES-576-25-5003 to S.G., S.R., N.B.); UK Department of Health (12167262) for Hypospadias Study.
The authors acknowledge, Paul Elliott, Mark Nieuwenhuijsen, Paul Nelson, Mireille Toledano, Nina Iszatt, and Daniela Fecht for help organizing the data, Isabelle Stucker and Sylvaine Cordier of INSERM for discussion. Conflict of Interest: None declared.
Google Scholar
Google Preview
| Month: | Total Views: |
|---|---|
| November 2016 | 11 |
| December 2016 | 8 |
| January 2017 | 26 |
| February 2017 | 49 |
| March 2017 | 84 |
| April 2017 | 32 |
| May 2017 | 38 |
| June 2017 | 36 |
| July 2017 | 25 |
| August 2017 | 27 |
| September 2017 | 35 |
| October 2017 | 50 |
| November 2017 | 44 |
| December 2017 | 319 |
| January 2018 | 103 |
| February 2018 | 185 |
| March 2018 | 218 |
| April 2018 | 171 |
| May 2018 | 168 |
| June 2018 | 132 |
| July 2018 | 128 |
| August 2018 | 280 |
| September 2018 | 203 |
| October 2018 | 266 |
| November 2018 | 263 |
| December 2018 | 314 |
| January 2019 | 229 |
| February 2019 | 258 |
| March 2019 | 263 |
| April 2019 | 203 |
| May 2019 | 201 |
| June 2019 | 160 |
| July 2019 | 146 |
| August 2019 | 125 |
| September 2019 | 118 |
| October 2019 | 182 |
| November 2019 | 187 |
| December 2019 | 155 |
| January 2020 | 115 |
| February 2020 | 143 |
| March 2020 | 154 |
| April 2020 | 278 |
| May 2020 | 161 |
| June 2020 | 206 |
| July 2020 | 195 |
| August 2020 | 216 |
| September 2020 | 230 |
| October 2020 | 224 |
| November 2020 | 271 |
| December 2020 | 226 |
| January 2021 | 170 |
| February 2021 | 224 |
| March 2021 | 263 |
| April 2021 | 291 |
| May 2021 | 260 |
| June 2021 | 213 |
| July 2021 | 170 |
| August 2021 | 180 |
| September 2021 | 194 |
| October 2021 | 348 |
| November 2021 | 310 |
| December 2021 | 240 |
| January 2022 | 235 |
| February 2022 | 225 |
| March 2022 | 306 |
| April 2022 | 297 |
| May 2022 | 266 |
| June 2022 | 220 |
| July 2022 | 172 |
| August 2022 | 170 |
| September 2022 | 244 |
| October 2022 | 276 |
| November 2022 | 196 |
| December 2022 | 163 |
| January 2023 | 212 |
| February 2023 | 192 |
| March 2023 | 241 |
| April 2023 | 257 |
| May 2023 | 209 |
| June 2023 | 188 |
| July 2023 | 179 |
| August 2023 | 164 |
| September 2023 | 157 |
| October 2023 | 226 |
| November 2023 | 257 |
| December 2023 | 172 |
| January 2024 | 287 |
| February 2024 | 290 |
| March 2024 | 349 |
| April 2024 | 337 |
| May 2024 | 662 |
| June 2024 | 200 |
| July 2024 | 181 |
| August 2024 | 150 |
Email alerts
Citing articles via.
- Biostatistics Blog
- Recommend to your Library
Affiliations
- Online ISSN 1468-4357
- Print ISSN 1465-4644
- Copyright © 2024 Oxford University Press
- About Oxford Academic
- Publish journals with us
- University press partners
- What we publish
- New features
- Open access
- Institutional account management
- Rights and permissions
- Get help with access
- Accessibility
- Advertising
- Media enquiries
- Oxford University Press
- Oxford Languages
- University of Oxford
Oxford University Press is a department of the University of Oxford. It furthers the University's objective of excellence in research, scholarship, and education by publishing worldwide
- Copyright © 2024 Oxford University Press
- Cookie settings
- Cookie policy
- Privacy policy
- Legal notice
This Feature Is Available To Subscribers Only
Sign In or Create an Account
This PDF is available to Subscribers Only
For full access to this pdf, sign in to an existing account, or purchase an annual subscription.
Open topic with navigation
Prospective vs. Retrospective Studies
Prospective
A prospective study watches for outcomes, such as the development of a disease, during the study period and relates this to other factors such as suspected risk or protection factor(s). The study usually involves taking a cohort of subjects and watching them over a long period. The outcome of interest should be common; otherwise, the number of outcomes observed will be too small to be statistically meaningful (indistinguishable from those that may have arisen by chance). All efforts should be made to avoid sources of bias such as the loss of individuals to follow up during the study. Prospective studies usually have fewer potential sources of bias and confounding than retrospective studies.
Retrospective
A retrospective study looks backwards and examines exposures to suspected risk or protection factors in relation to an outcome that is established at the start of the study. Many valuable case-control studies, such as Lane and Claypon's 1926 investigation of risk factors for breast cancer, were retrospective investigations. Most sources of error due to confounding and bias are more common in retrospective studies than in prospective studies. For this reason, retrospective investigations are often criticised. If the outcome of interest is uncommon, however, the size of prospective investigation required to estimate relative risk is often too large to be feasible. In retrospective studies the odds ratio provides an estimate of relative risk. You should take special care to avoid sources of bias and confounding in retrospective studies.
Prospective investigation is required to make precise estimates of either the incidence of an outcome or the relative risk of an outcome based on exposure.
Case-Control studies
Case-Control studies are usually but not exclusively retrospective, the opposite is true for cohort studies. The following notes relate case-control to cohort studies:
- outcome is measured before exposure
- controls are selected on the basis of not having the outcome
- good for rare outcomes
- relatively inexpensive
- smaller numbers required
- quicker to complete
- prone to selection bias
- prone to recall/retrospective bias
- related methods are risk (retrospective) , chi-square 2 by 2 test , Fisher's exact test , exact confidence interval for odds ratio , odds ratio meta-analysis and conditional logistic regression .
Cohort studies
Cohort studies are usually but not exclusively prospective, the opposite is true for case-control studies. The following notes relate cohort to case-control studies:
- outcome is measured after exposure
- yields true incidence rates and relative risks
- may uncover unanticipated associations with outcome
- best for common outcomes
- requires large numbers
- takes a long time to complete
- prone to attrition bias (compensate by using person-time methods)
- prone to the bias of change in methods over time
- related methods are risk (prospective) , relative risk meta-analysis , risk difference meta-analysis and proportions
Copyright © 1987-2024 Iain E. Buchan, all rights reserved. Download software here .

- Get Started
- Determine Protocol Type
- Not Human Subjects Research and Not Research
Case Study Types
Is my case study considered human subjects research, retrospective case study review/report.
- Generally completed by a retrospective review of medical records that highlights a unique treatment, case, or outcome
- Often clinical in nature
- A report about five or fewer clinical experiences or observations identified during clinical care
- Does not involve biospecimens or FDA-regulated products (e.g., drugs, devices, biologics) that have not been approved for use in humans
- Does not include articles requiring exemption from FDA oversight
- Does not include articles under an IND/IDE
Prospective Single Subject Case Study Review/Report
- Often social/behavioral in nature
- In-depth prospective analysis and report involving unique or exceptional observations or experiences about one, or a few, individual human subjects
- Is intended to contribute to generalizable knowledge
Treatment Efficacy of Theophylline in ADYC5 Dyskinesia: A Retrospective Case Series Study
- Find this author on Google Scholar
- Find this author on PubMed
- Search for this author on this site
- ORCID record for Frank Hause
- ORCID record for Andreas Merkenschlager
- ORCID record for Andrea Sinz
- For correspondence: [email protected]
- Info/History
- Supplementary material
- Preview PDF
Background ADCY5-related dyskinesia is a rare disorder caused by mutations in the ADCY5 gene resulting in abnormal involuntary movements. Currently, there are no standardized guidelines to treat this condition. Objectives The aim of this study is to evaluate the efficacy of theophylline administration in improving symptoms and quality of life in patients with ADCY5-related dyskinesia. Methods A retrospective study was conducted involving 12 patients (aged 2-34 years) with ADCY5-related dyskinesia. Participants completed a questionnaire about theophylline administration, including dosage, improvement of symptoms, adverse effects, and changes in quality of life. Data were analyzed for reported efficacy and side effects. Results Theophylline administration demonstrated substantial efficacy, with 92% (11 out of 12) of patients reporting significant improvements in their movement disorders. The average improvement score was 7.0 (SD 1.9) on a 10-point scale. Notable improvements included reductions in severity and frequency of episodes, improved gait, more independent mobility, psycho-social well-being, and quality of sleep. Adverse effects were reported by 6 patients, including dystonia, speech worsening, headaches, nausea, impaired sleep, and agitation. Conclusions Theophylline shows substantial promise as a treatment option for ADCY5-related dyskinesia, improving various aspects of patients' quality of life and movement disorder symptoms. Further research is needed to optimize dosing, to understand long-term effects, and to explore combinational drug therapies. Despite the small cohort size and the retrospective nature of this study, the results support theophylline administration to decrease dyskinetic movements and enhance overall quality of life in patients.
Competing Interest Statement
The authors have declared no competing interest.
Funding Statement
AS acknowledges financial support by the DFG (RTG 2467, project number 391498659 'Intrinsically Disordered Proteins-Molecular Principles, Cellular Functions, and Diseases', INST 271/404-1 FUGG, INST 271/405-1 FUGG), the Federal Ministry for Economic Affairs and Energy (BMWi, ZIM project KK5096401SK0), the region of Saxony-Anhalt, and the Martin Luther University Halle-Wittenberg (Center for Structural Mass Spectrometry).
Author Declarations
I confirm all relevant ethical guidelines have been followed, and any necessary IRB and/or ethics committee approvals have been obtained.
The details of the IRB/oversight body that provided approval or exemption for the research described are given below:
Ethics committee of the Medical Faculty, University of Leipzig gave ethical approval for this work. All patients, or their authorized representatives, provided written informed consent prior to participation in this study.
I confirm that all necessary patient/participant consent has been obtained and the appropriate institutional forms have been archived, and that any patient/participant/sample identifiers included were not known to anyone (e.g., hospital staff, patients or participants themselves) outside the research group so cannot be used to identify individuals.
I understand that all clinical trials and any other prospective interventional studies must be registered with an ICMJE-approved registry, such as ClinicalTrials.gov. I confirm that any such study reported in the manuscript has been registered and the trial registration ID is provided (note: if posting a prospective study registered retrospectively, please provide a statement in the trial ID field explaining why the study was not registered in advance).
I have followed all appropriate research reporting guidelines, such as any relevant EQUATOR Network research reporting checklist(s) and other pertinent material, if applicable.
Data Availability
All data produced in the present study are available upon reasonable request to the authors. The questionnaire provided to the patients is available as online supplemental data.
View the discussion thread.
Supplementary Material
Thank you for your interest in spreading the word about medRxiv.
NOTE: Your email address is requested solely to identify you as the sender of this article.

Citation Manager Formats
- EndNote (tagged)
- EndNote 8 (xml)
- RefWorks Tagged
- Ref Manager
- Tweet Widget
- Facebook Like
- Google Plus One
Subject Area
- Genetic and Genomic Medicine
- Addiction Medicine (342)
- Allergy and Immunology (665)
- Anesthesia (180)
- Cardiovascular Medicine (2625)
- Dentistry and Oral Medicine (314)
- Dermatology (222)
- Emergency Medicine (397)
- Endocrinology (including Diabetes Mellitus and Metabolic Disease) (930)
- Epidemiology (12176)
- Forensic Medicine (10)
- Gastroenterology (756)
- Genetic and Genomic Medicine (4064)
- Geriatric Medicine (385)
- Health Economics (676)
- Health Informatics (2625)
- Health Policy (997)
- Health Systems and Quality Improvement (979)
- Hematology (360)
- HIV/AIDS (845)
- Infectious Diseases (except HIV/AIDS) (13659)
- Intensive Care and Critical Care Medicine (790)
- Medical Education (398)
- Medical Ethics (109)
- Nephrology (430)
- Neurology (3834)
- Nursing (209)
- Nutrition (570)
- Obstetrics and Gynecology (734)
- Occupational and Environmental Health (690)
- Oncology (2008)
- Ophthalmology (581)
- Orthopedics (238)
- Otolaryngology (304)
- Pain Medicine (250)
- Palliative Medicine (73)
- Pathology (471)
- Pediatrics (1107)
- Pharmacology and Therapeutics (459)
- Primary Care Research (447)
- Psychiatry and Clinical Psychology (3400)
- Public and Global Health (6499)
- Radiology and Imaging (1390)
- Rehabilitation Medicine and Physical Therapy (806)
- Respiratory Medicine (869)
- Rheumatology (400)
- Sexual and Reproductive Health (407)
- Sports Medicine (338)
- Surgery (441)
- Toxicology (52)
- Transplantation (185)
- Urology (165)
- Open access
- Published: 22 August 2024
When is surgical intervention needed in oral and maxillofacial space infection patients? A retrospective case control study in 46 patients
- Yimin Liu 1 , 2 , 3 , 4 , 5 , 6 na1 ,
- Hanyi Zhu 1 , 2 , 3 , 4 , 5 , 6 na1 ,
- Xin Bao 1 , 2 , 3 , 4 , 5 , 6 ,
- Yingyi Qin 7 ,
- Zhiyuan He 2 , 3 , 4 , 5 , 6 ,
- Lingyan Zheng 1 , 2 , 3 , 4 , 5 , 6 &
- Huan Shi 1 , 2 , 3 , 4 , 5 , 6
BMC Oral Health volume 24 , Article number: 973 ( 2024 ) Cite this article
33 Accesses
Metrics details
Patients with mild oral and maxillofacial space infection (OMSI) usually need only antimicrobial therapy. However, surgical intervention is eventually needed after using antibiotics for a period. The objective of this study was to explore the risk factors for drug therapy failure in OMSI.
Subjects and methods
A retrospective case‒control study was designed. From August 2020 to September 2022, patients at Shanghai Jiao Tong University Affiliated Ninth People’s Hospital who were diagnosed with OMSI were retrospectively reviewed. The outcome variable was surgical intervention after the use of antibiotics. We collected common biological factors, including demographic characteristics, routine blood test results, C-reactive protein (CRP) levels and composite indicators, such as neutrophil to lymphocyte ratio (NLR) and platelet to lymphocyte ratio (PLR). The χ2 test and binary logistic regression were used to examine the association between biological factors and the outcome variable.
Forty-six patients were included in this study. Further surgical intervention was needed in 20 patients (43.5%). The NLR showed a significant association with further surgical drainage ( p = 0.01). A binary logistic regression equation was found by using stepwise regression based on the Akaike information criterion (R2 = 0.443), which was associated with sex (odds ratio [OR], 0.216; p = 0.092), NLR (OR, 1.258; p = 0.045), red blood cell (RBC) count (OR, 4.372; p = 0.103) and monocyte (MONO) count (OR, 9.528, p = 0.023). Receiver operating characteristic analysis produced an area under the curve for NLR of 0.725 ( p = 0.01) and for the binary logistic regression model of 0.8365 ( p < 0.001).
Surgical interventions are needed in some mild OMSI patients when antimicrobial therapy fails to stop the formation of abscesses. The binary logistic regression model shows that NLR can be used as an ideal prognostic factor to predict the outcome of antimicrobial therapy and the possibility of requiring surgical intervention.
Statement of clinical relevance
Using simple, inexpensive, and easily achieved biological parameters (such as routine blood test results) and composite indicators calculated by them (such as NLR) to predict whether surgical intervention is needed in the future provides a reference for clinical doctors and enables more cost-effective and efficient diagnosis and treatment.
Peer Review reports
Introduction
Oral and maxillofacial space infection (OMSI) primarily originates from odontogenic infection and can also occur as a result of adenogenic, haematogenous or latrogenic factors. The infection can spread widely through cellular-adipose tissue and fascial planes in the maxillofacial region. This allows the infection to penetrate deeper into the tissues and can result in the development of OMSI cellulitis or the formation of abscess [ 1 ]. When an abscess has formed with purulent collection during infection evolution, surgical intervention is needed to expel pus and necrotic tissue from the body. It is necessary and effective in reducing local pain and swelling, as well as preventing apnoea. It also guards against infection diffusion to the craniocerebral region or blood circulation, causing serious complications, including brain abscess, Ludwig’s angina and descending necrotizing mediastinitis [ 2 ]. These complications can have detrimental effects on the patient’s health and may require additional interventions for management.
If a contrast CT scan does not reveal obvious signs of abscess, the common practice is to administer antimicrobial therapy. After a few days of treatment, medical staff need to monitor the patient closely to assess if the cellulitis is shrinking or if the infection is worsening to the extent of developing one or multiple abscesses. Once a contrast CT scan confirms the presence of purulent collection after antibiotherapy, surgical intervention is required to achieve the therapeutic goals mentioned above.
Patients who require surgery often experience more severe clinical symptoms, accompanied by a higher risk of complications. For some of them, the infection may become severe enough to warrant hospitalization. This not only adds to the physical and emotional burden experienced by patients but also leads to increased financial expenses. Moreover, the prolonged absence from work or school due to hospitalization further adds to the financial burden and can have negative consequences on the patients’ professional or academic life. In addition, intraoral surgical incisions for drainage tend to be less concerning aesthetically for patients; however, extraoral incisions may result in aesthetic sequelae that could impact the patient’s self-esteem and quality of life. Furthermore, more medical resource inputs are placed in these patients since they require specialized care, including frequent monitoring and wound dressing [ 3 ]. Consequently, the surgical intervention should be well indicated and justified. However, to our knowledge, few studies have explored risk factors associated with surgical intervention in patients with mild infection. Further studies in this area can improve patient care and outcomes.
The neutrophil to lymphocyte ratio (NLR) is a systemic inflammatory indicator derived from routine haematological parameters, which currently has been reported as an independent predictor in inflammation-associated diseases such as malignant tumours, cardiovascular diseases, and neurological diseases [ 4 , 5 , 6 , 7 ]. NLR has attracted considerable attention for its ease and low cost in prediction. Research has reported that during inflammatory stress, neutrophils increase, and lymphocytes undergo apoptosis, resulting in an elevated NLR [ 8 ]. In terms of OMSI, NLR has been mentioned as an emerging predicator. Research has reported that the NLR contributes to the severity of infection in terms of the involved spaces and complications in severe and extremely severe oral and maxillofacial space infection patients [ 9 ]. It is also regarded as a prognostic marker of deep neck space infections second to odontogenic infection [ 10 , 11 ]. There is evidence that NLR significantly decreases after surgical drainage in odontogenic cervicofacial phlegmon patients, while it remains at a high level on admission to the hospital [ 12 ]. Higher NLR values may lead to unfavourable prognoses in sepsis patients [ 13 ].
Some routine haematological parameters are associated with severity in OMSI, such as white blood cell (WBC) count, neutrophil (NEU) count and C-reactive protein (CRP) level. Utilizing these haematological parameters, previous studies have attempted to predict clinical outcomes such as the length of hospital stay and reoperation rate [ 14 , 15 , 16 , 17 ].
The purpose of the study was to explore the diagnostic value of common haematological parameters and composite parameters, such as NLR, in predicting the possibility that surgical intervention may eventually be required in mild OMSI patients to assist clinicians in making accurate early diagnoses.
From August 2020 to September 2022, 46 patients at Shanghai Jiao Tong University Affiliated Ninth People’s Hospital diagnosed with OMSI were included in a retrospective study (Fig. 1 ).

Flow chart of the retrospective study
The inclusion criteria for patients with OMSI were as follows: (1) clinical manifestations of typical inflammation, including local redness, swelling, pain, increased skin temperature, and local dysfunction; (2) inflammatory indicators at a high level supporting the diagnosis of inflammation; (3) a contrast CT scan showing no obvious evidence for abscess formation at the first visit; and (4) treatment with antimicrobial therapy received from hospital for no less than 3 days.
The exclusion criteria were as follows: (1) malignant tumour-related infection; (2) previous surgical intervention before the first visit at our hospital; (3) pregnancy; and (4) self-medication with antibiotics before or after the first visit.
All the procedures of the study were in accordance with the Declaration of Helsinki and approved by the Ethics Committee of Shanghai Jiao Tong University School of Medicine Affiliated Ninth People’s Hospital (SH9H-2021-T400-2).
The outcome variable was surgical intervention after antimicrobial therapy failure.
Surgical intervention was performed when there was presence of abscess formation, which was detected by a contrast CT. The potential predictor variables consisted of demographic characteristics and laboratory examination. Demographic characteristics included patient age at first visit to the hospital and gender (male or female). Laboratory examination comprised both routine full and differential blood cell counts (lymphocytes, leukocytes, neutrophils, eosinophils, basophils, and monocytes) (categorized as normal or abnormal), CRP levels (categorized as normal or abnormal), and composite indicators, including NLR and platelet to lymphocyte ratio (PLR). The clinical laboratory of Shanghai Jiao Tong University School of Medicine Affiliated Ninth People’s Hospital conducted thorough examinations to determine whether the laboratory test results fell within the normal range or exhibited abnormalities.
Statistical analysis
The study variables were acquired from each patient’s medical records. Multiple imputation was used to fill 4 missing data points. Continuous variables are reported as the mean and standard deviation. The Mann‒Whitney U test was used to test the association between continuous predictor variables and the outcome variable. Categorical variables are reported as percentages and were tested by the χ2 test. p < 0.05 was considered statistically significant. All variables with p < 0.2 were included in the multicollinearity test, and then the selected variables were used to build a binary logistic regression model by stepwise selection based on the Akaike information criterion (AIC).
Receiver operating characteristic (ROC) curve analysis was used to evaluate the predictive effect and diagnostic value of different biological variables and the combination of multiple factors on surgical intervention. We used a calibration curve to assess calibration accuracy, accompanied by the Hosmer‒Lemeshow test. We also used forest plots and nomograms to visualize the comprehensive results of the model.
Analyses were performed using R statistical software.
A total of 46 patients diagnosed with OMSI were enrolled in this study. None of the patients had formed an abscess by their first visit. Table 1 presents the study variables, encompassing the population characteristics and haematological parameters of the patients. The study population consisted of 27 males (58.7%) and 19 females (41.3%), resulting in an almost equal distribution in terms of gender. Their ages ranged from 8 to 94 years, with a mean age of 53.6 (± 19.0) years. Abnormal haematological results accounted for 73.9% (34) of WBC counts, 80.4% (37) of neutrophil cell (NEU) counts, and 82.6% (38) of CRP levels. Additional details can be found in Table 1 . The specific data of the haematological examination results are provided in Table S1 in the Supplementary Materials. In Table S2 in the Supplementary Materials, abnormal value markers for all haematological indicators are provided, indicating whether the abnormal values are higher or lower relative to the normal values. Except for HCT, EOS count, and MONO percentage, the abnormal values for all other indicators uniformly demonstrate a consistent trend of being either higher or lower in comparison to the normal values. The mean NLR was 7.7 ± 4.9.
Twenty patients underwent surgical drainage, resulting in a surgery rate of 43.5% in the study population. The results of the association between the study variables and the outcome variable are presented in Table 2 . Four variables (WBC count, NEU count, MONO count and NLR) exhibited a significant correlation with surgical intervention ( p < 0.05). Additionally, there was a tendency for RBC count, EOS percentage (0.05 < p < 0.1), sex, NEU count and LYM count (0.1 < p < 0.2) to be correlated with surgical intervention. The abnormal values of the above haematological variables all show the same trend of being either higher or lower relative to the normal values.
After including the correlated variables ( p < 0.2) into the binary logistic regression analysis as mentioned earlier, we found that four variables, including sex, NLR, RBC count and MONO count, remained significant in the final model (Table 3 ).
An increase in NLR and abnormalities in RBC count and MONO count were found to increase the likelihood of undergoing surgical intervention; however, being female was associated with a decreased likelihood of undergoing surgical intervention.
The ROC curve was used to analyse the performance of the regression model and independent variables in the model in predicting surgical intervention (Fig. 2 ).

The ROC curve indicated that NLR was able to effectively distinguish the rate of surgical intervention after antimicrobial therapy failure. NLR demonstrated a 72.5% accuracy (AUC 0.725 [95% CI 0.578–0.872], p = 0.01), with a cut-off value of 5.50 predicting surgical intervention with 80.0% sensitivity and 61.5% specificity.
Moreover, the ROC curve revealed that the predictive ability of multiple variables was superior to that of a single factor. The regression model had 83.7% accuracy (AUC 0.837 [95% CI 0.720–0.953], p < 0.001).
We also used forest plots and nomograms to visually present the comprehensive results of the regression model. In the forest plot, the influence of various variables is graphically depicted, providing a comprehensive overview of the effect size for each individual variable as well as the collective effect size. It becomes evident that an elevation in the count of MONO, RBC, and NLR is indicative of a risk factor. Conversely, being female is associated with a protective effect. Additionally, NLR, as an influential factor within the multifactorial model, exhibits a relatively narrow confidence interval and a statistically significant p -value (Fig. 3 ). Utilizing logistic regression, a scoring criterion is established within the nomogram, based on the regression coefficients of the independent variables. The ‘risk’ indicated on the final line, derived from the ‘total points’, serves to represent the model’s predicted risk level, thereby enhancing the comprehensibility and interpretability of the predictive outcomes (Fig. 4 ).

Forest plot. *The dashed line (x = 1) represents an invalid line. The solid horizontal line represents the results of each study variable. Lines on the left side of the valid line indicate protective factors, while lines on the right side indicate risk factors. The size of the diamond represents the weight of each variable in the model, and the colour indicates the p value. The length of the solid lines represents the 95% CI

Nomogram. *To determine the risk of undergoing surgical intervention predicted by the logistic regression model, these steps were followed: a vertical line was made from the axis of each parameter, and the corresponding value on the line labelled ‘Points’ was located. The points of all the parameters were added together. Then, another vertical line was drawn from the axis labelled ‘Total Points’, and the corresponding number on the ‘Risk’ axes was found. The number on the line labelled ‘Risk’ represents the predicted risk of undergoing surgical intervention
Next, we utilized the calibration curve to demonstrate a strong agreement between the prediction and observation in the study cohort (Fig. 5 ). Additionally, the Hosmer‒Lemeshow test yielded a nonsignificant statistic ( p = 0.693), indicating no deviation from a perfect fit.

Calibration curve. *The calibration curve illustrates the agreement between the predicted risks of surgical intervention and the observed actual risks of surgical intervention. The x-axis represents the predicted probability of surgical intervention, while the y-axis represents the observed probability of surgical intervention. The diagonal dotted line represents the ideal predicted results of a perfect model. On the other hand, the solid line represents the predictions made by our bias-corrected regression model. The closer the solid line is to the diagonal dotted line, the more accurate the calibration of the model
The aim of the study was to explore risk factors associated with surgical intervention in OMSI patients. Although we found that several variables showed a correlation tendency with the outcome in the single-factor screening, binary logistic regression ultimately identified 4 key variables: male sex showed negative associations, increased NLR showed positive associations, and abnormal MONO count and RBC count showed positive associations. Among all the factors, NLR, as a composite index, was found to have a significant association with surgical intervention. When used as an independent predictor, the NLR showed good discrimination between outcomes. Additionally, when included as a component in the multivariable regression model, it improved the prediction performance, making the model’s ability to predict superior to that of a single factor.
The proportion of male and female patients in the study was relatively balanced, and males comprised 58.7% of the study population. The average age was 53.6 years, which was also close to the population characteristics in other studies on OMSI [ 18 , 19 ].
Gender differences are a controversial risk factor related to OMSI. Samuel et al. analysed 1002 hospitalized patients diagnosed with OMSI and found that the probability of males needing immediate airway management was significantly higher than that of females (male 7% vs. female 2%, p = 0.001), the WBC count in males was significantly higher than that in females (male 12.4*10 9 /L vs. female 11.1*10 9 /L, p = 0.000), and C-reactive protein was also significantly higher than that in females (male 78 mg/L vs. female 59 mg/L, p = 0.001) [ 20 ]. Multiple studies have indicated that male patients face a higher risk of hospitalization following surgeries and a greater likelihood of requiring intensive care unit (ICU) treatment [ 14 , 21 ]. However, there were also studies showing little correlation between gender and OMSI severity in terms of length and cost of hospitalization, severe complications and reoperation risk [ 3 , 10 , 17 ]. The final regression model of our study retained gender as a risk factor associated with the outcome. The OR value of sex was 0.21 < 1, indicating that female sex was a protective factor, which was consistent with previous studies. The final regression model of our study found that gender was not statistically significant in relation to the outcome ( p = 0.092). However, importantly, insignificance does not necessarily mean that the variable should be removed from the model, as a small sample size could also contribute to this result. The use of backwards stepwise selection based on AIC made the result acceptable.
Serum laboratory tests are relatively simple and inexpensive. They are easy to perform and widely accepted by most individuals. We selected routine blood tests and CRP levels as the parameters to be examined, which can provide results quickly. Since these parameters are routinely tested in almost every infection patient who visits the hospital, the prediction can be made at no additional cost. In summary, the prediction can be done quickly and does not impose any extra financial or time burden on the patients.
The NLR has been widely used in prognostic prediction in inflammation-associated diseases such as malignant tumours. In the context of OMSI, it is commonly used as a predictive factor for severe complications and the length of hospitalization [ 9 , 10 , 22 ]. However, we have not come across any research related to NLR in relation to mild OMSI. Our study demonstrated that the NLR significantly influenced surgical intervention and acted as a risk factor ( p = 0.045, OR = 1.26 [95% CI 1.01–1.57]). The ROC curve analysis revealed that NLR had higher accuracy than other risk factors (AUC = 0.725, p = 0.01), indicating its ability to correctly identify patients in need of surgical intervention. The determined cut-off value was 5.50, which may provide a reference for clinical work. Furthermore, the final regression model showed even better discrimination (AUC = 0.837, p < 0.001), suggesting that multiple variables have a stronger impact on the outcome and yield higher discrimination in the results. This provides a reliable basis for determining further surgery and can be considered a criterion for judgement in subsequent clinical decisions. The forest plot and nomogram were used to visualize the results of the regression model. The nomogram, in particular, makes it easy and quick to use the model. These tools provide reliable references for clinical doctors and enable a higher level of nurse care for patients. Additionally, they can help decrease unnecessary consumption of medical resources.
During infection, MONOs further differentiate into tissue macrophages and dendritic cells, thereby mediating the immune response. They also possess the ability to be recruited to the site of infection and directly engage in antibacterial activity. Additionally, they participate in the initial inflammatory response by releasing factors such as tumour necrosis factor (TNF) and chemokines [ 23 , 24 ]. All 32 abnormal MONO counts in our study were higher than the normal range. In our statistical analysis, MONO count was found to be significantly associated with the outcome ( p = 0.023), suggesting that a higher MONO count could be regarded as a risk factor (OR = 9.53 [95% CI 1.37–66.17]). However, the confidence interval for this association was wide, possibly due to the use of categorical variables in the statistical analysis or the small sample size and unstable distribution. In further studies, it is recommended to increase the sample size and report MONO count as a continuous variable to better observe its impact on the outcome.
RBCs undergo activation during inflammation triggered by bacterial infection, leading to a sequence of pathological alterations such as erythrocyte deformation and programmed cell death [ 25 ]. E. Pretorius et al. reported that the erythrocyte membrane interacts with inflammatory molecules, resulting in erythrocyte deformation and programmed cell death. These processes have an impact on haemorheology and can serve as a parameter for identifying the presence and extent of inflammation [ 26 ]. In our study, all 17 abnormal RBC counts were found to be lower than the normal range, which is consistent with previous studies. The final model in our study included RBC count as a risk factor (OR = 4.37 [95% CI 1.37–66.17], p = 0.103]). Similar to the MONO count, the confidence interval was also wide, indicating that further confirmation is needed to determine its specific impact on the outcome.
In addition, we observed a lack of correlation between surgical drainage and CRP levels. This finding is in contrast to previous studies that have demonstrated a relationship between CRP levels and factors such as the length of hospitalization, the number of spaces involved, and the rate of reoperation in OMSI patients [ 15 , 17 , 27 ]. In our study cohort, 82.6% of patients had abnormal CRP levels. This high prevalence can be attributed to the fact that CRP is a highly sensitive and responsive indicator of acute infection [ 28 , 29 ]. Furthermore, we treated CRP level as a categorical variable in our analysis, so the results we obtained showed no significant difference between the group that underwent a surgical intervention and the group that did not.
The study is an exploratory retrospective case‒control study, which inherently has limitations. The small sample size resulted in some statistical results being unstable. Only population characteristics and simple serum laboratory test results were analysed, while other potential risk factors, such as spaces involved, potential systemic diseases, clinical symptoms at admission (fever, pain, mouth opening, etc.), and basic vital signs (blood pressure, pulse, temperature, etc.), were not included in the analysis.
Within limitations associated to the present study, NLR has been found as an effective parameter for predicting surgical intervention in mild OMSI patients. Additionally, sex, MONO count and RBC count also contributed to the outcome. The application of simple and easily accessible serum tests to predict surgical intervention enables the efficiency and effectiveness of medical resources while also providing more opportunities to deliver higher quality care to patients.
Availability of data and materials
All data generated or analysed during this study are included in this published article and its supplementary information files.
Abbreviations
Akaike information criterion
Area under curve
Basophil granulocyte
Confidence Interval
C-reactive protein
Eosinophils
Haemoglobin
Haematocrit
Intensive care unit
Lymphocyte cell
Neutrophil cell
- Neutrophil to lymphocyte ratio
- Oral and maxillofacial space infection
Platelet to lymphocyte ratio
Red blood cell
Receiver operating characteristic
Tumour necrosis factor
White blood cell
Ogle OE. Odontogenic infections. Dent Clin North Am. 2017;61:235–52. https://doi.org/10.1016/j.cden.2016.11.004 .
Article PubMed Google Scholar
Robertson DP, Keys W, Rautemaa-Richardson R, Burns R, Smith AJ. Management of severe acute dental infections. Bmj-Brit Med J. 2015. https://doi.org/10.1136/bmj.h1300 .
Article Google Scholar
Kim MK, Nalliah RP, Lee MK, Allareddy V. (2012) Factors associated with length of stay and hospital charges for patients hospitalized with mouth cellulitis. Or Surg or Med or Pa. 2012;113:21–8. https://doi.org/10.1016/j.tripleo.2011.01.012 .
Corbeau I, Jacot W, Guiu, S. Neutrophil to lymphocyte ratio as prognostic and predictive factor in breast cancer patients: a systematic review. Cancers 2020;12. https://doi.org/10.3390/cancers12040958 .
Liu J, Zhang SN, Mi RH, Chen L, Yin QS. Prognostic significance of the neutrophil-to-lymphocyte ratio in peripheral T-cell lymphoma: a meta-analysis. Cancer Cell Int 21. 2021. https://doi.org/10.1186/s12935-021-02391-z .
Lattanzi S, Cagnetti C, Rinaldi C, Angelocola S, Provinciali L, Silvestrini M. Neutrophil-to-lymphocyte ratio improves outcome prediction of acute intracerebral hemorrhage. J Neurol Sci. 2018;387:98–102. https://doi.org/10.1016/j.jns .
Ferro D, Matias M, Neto J, Dias R, Moreira G, Petersen N, et al. Neutrophil-to-lymphocyte ratio predicts cerebral edema and clinical worsening early after reperfusion therapy in stroke. Stroke. 2021;52(3):859–67. https://doi.org/10.1161/Strokeaha.120.032130 .
Article CAS PubMed Google Scholar
Le Tulzo Y, Pangault C, Gacouin A, Guilloux V, Tribut O, Amiot L, et al. Early circulating lymphocyte apoptosis in human septic shock is associated with poor outcome. Shock. 2002;18(6):487–94. https://doi.org/10.1097/00024382-200212000-00001 .
Li XJ, Liu H, Gong ZC, Wang CG, Niu YQ. The predictive value of interleukin-6 and neutrophil-lymphocyte ratio in patients with severe and extremely severe oral and maxillofacial space infections. Biomed Res Int. 2021. https://doi.org/10.1155/2021/2615059 .
Article PubMed PubMed Central Google Scholar
Gallagher N, Collyer J, Bowe CM. Neutrophil to lymphocyte ratio as a prognostic marker of deep neck space infections secondary to odontogenic infection. Brit J Oral Max Surg. 2021;59:228–32. https://doi.org/10.1016/j.bjoms.2020.08.075 .
Article CAS Google Scholar
Kusumoto J,Iwata E, Huang WS, Takata N, Tachibana A, Akashi M. Hematologic and inflammatory parameters for determining severity of odontogenic infections at admission: a retrospective study. BMC Infect Dis 2022;22(1). https://doi.org/10.1186/s12879-022-07934-x .
Roi CI, Roi A, Nicoara A, Nica D, Rusu LC, Soanca A, et al. Impact of treatment on systemic immune-inflammatory index and other inflammatory markers in odontogenic cervicofacial phlegmon cases: a retrospective study. Biomedicines 2023;11(6). https://doi.org/10.3390/biomedicines11061710 .
Huang ZW, Fu ZY, Huang WJ, Huang KG. Prognostic value of neutrophil-to-lymphocyte ratio in sepsis: a meta-analysis. Am J Emerg Med. 2020;38(3):641–7. https://doi.org/10.1016/j.ajem.2019.10.023 .
Begue L, Schlund M, Raoul G, Ferri J, Lauwers L, Nicot R. Biological factors predicting the length of hospital stay in odontogenic cellulitis. J Stomatol Oral Maxillofacial Surg. 2022;123(3):303–8. https://doi.org/10.1016/j.jormas.2021.07.007 .
Heim N, Wiedemeyer V, Reich RH, Martini M. The role of C-reactive protein and white blood cell count in the prediction of length of stay in hospital and severity of odontogenic abscess. J Cranio Maxill Surg. 2018;46:2220–6. https://doi.org/10.1016/j.jcms.2018.10.013 .
Stathopoulos P, Igoumenakis D, Shuttleworth J, Smith W, Ameerally P. Predictive factors of hospital stay in patients with odontogenic maxillofacial infections: the role of C-reactive protein. Brit J Oral Max Surg. 2017;55:367–70. https://doi.org/10.1016/j.bjoms.2016.11.004 .
Christensen BJ, Racha D, Hinkle R, Sahebi M. Risk factors for reoperation in patients hospitalized for odontogenic infections. J Oral Maxil Surg. 2021;79:141–51. https://doi.org/10.1016/j.joms.2020.06.032 .
Christensen B, Han M, Dillon JK. The cause of cost in the management of odontogenic infections 1: a demographic survey and multivariate analysis. J Oral Maxil Surg. 2013;71:2058–67. https://doi.org/10.1016/j.joms.2013.05.026 .
Heim N, Berger M, Wiedemeyer V, Reich R, Martini M. A mathematical approach improves the predictability of length of hospitalization due to acute odontogenic infection: A retrospective investigation of 303 patients. J Cranio-Maxillofacial Surg. 2019;47(2):334–40. https://doi.org/10.1016/j.jcms.2018.12.002 .
Kent S, Regan A, McDonald C, Henry A, Dawoud B, Hennedige A. Gender differences in patients with severe dental infections presenting to hospital. Br Dent J. 2021. https://doi.org/10.1038/s41415-020-2351-7 .
Vilen ST, Ahde H, Puolakka T, Makitie A, Uittamo J, Snall J. Differences in characteristics and infection severity between odontogenic and other bacterial oro-naso-pharyngeal infections. Head Face Med 2023;19(1). https://doi.org/10.1186/s13005-023-00354-5 .
Gujrathi AB, Ambulgekar V, Kathait P. Deep neck space infection - A retrospective study of 270 cases at tertiary care center. World J Otorhinolaryngol Head Neck Surg. 2016;2:208–13. https://doi.org/10.1016/j.wjorl.2016.11.003 .
Shi C, Pamer EG. Monocyte recruitment during infection and inflammation. Nat Rev Immunol. 2011;11:762–74. https://doi.org/10.1038/nri3070 .
Article CAS PubMed PubMed Central Google Scholar
Serbina NV, Jia T, Hohl TM, Pamere EG. Monocyte-mediated defense against microbial pathogens. Annu Rev Immunol. 2008;26:421–52. https://doi.org/10.1146/annurev.immunol.26.021607.090326 .
Silva AFB, Sousa JS, Cunha PLR, Lima JV, Alencar NMN, Freitas CDT. Erythrocytes morphology and hemorheology in severe bacterial infection. Memorias Do Instituto Oswaldo Cruz, 2019;114. https://doi.org/10.1590/0074-02760190326 .
Pretorius E. Erythrocyte deformability and eryptosis during inflammation, and impaired blood rheology. Clin Hemorheol Micro. 2018;69:545–50. https://doi.org/10.3233/Ch-189205 .
Mirochnik R, Araida S, Yaffe V, Abu E-N. C-reactive protein concentration as a prognostic factor for inflammation in the management of odontogenic infections. Brit J Oral Max Surg. 2017;55:1013–7. https://doi.org/10.1016/j.bjoms.2017.10.006 .
Sharma A, Giraddi G, Krishnan G, Shahi AK. Efficacy of serum Prealbumin and CRP levels as monitoring tools for patients with fascial space infections of odontogenic origin: a clinicobiochemical study. J Maxillofac Oral Surg. 2014;13:1–9. https://doi.org/10.1007/s12663-012-0376-4 .
Ren YF, Malmstrom HS. Rapid quantitative determination of C-reactive protein at chair side in dental emergency patients. Oral Surg Oral Med O. 2007;104:49–55. https://doi.org/10.1016/j.tripleo.2007.01.007 .
Download references
Acknowledgements
Not applicable.
This study was supported by the National Natural Science Foundation of China (Grant No.82174041, 82302553, 82370976), Shanghai Young Science and Technology Talents Sailing Program (Grant No. 22YF1422300) and the Biological Sample Bank Project of Ninth People’s Hospital Affiliated with Shanghai Jiao Tong University School of Medicine (Grant No.YBKB202107, YBYB202212).
Author information
Yimin Liu and Hanyi Zhu contributed equally to this work.
Authors and Affiliations
College of Stomatology, Shanghai Jiao Tong University, Shanghai, China
Yimin Liu, Hanyi Zhu, Xin Bao, Lingyan Zheng & Huan Shi
Department of Oral Surgery, Shanghai Ninth People’s Hospital, Shanghai Jiao Tong University School of Medicine, No. 639, ZhiZaoJu Road, Shanghai, 200011, China
Yimin Liu, Hanyi Zhu, Xin Bao, Zhiyuan He, Lingyan Zheng & Huan Shi
National Center for Stomatology, Shanghai, China
National Clinical Research Center for Oral Diseases, Shanghai, China
Shanghai Key Laboratory of Stomatology, Shanghai, China
Shanghai Research Institute of Stomatology, Shanghai, China
Department of Health Statistics, Second Military Medical University, Shanghai, China
You can also search for this author in PubMed Google Scholar
Contributions
Lingyan Zheng and Huan Shi made substantial contributions to the conception. Yimin Liu and Huan Shi designed the work. Yimin Liu, Hanyi Zhu, Xin Bao and Zhiyuan He acquired the data. Yinyi Qin, Yimin Liu and Hanyi Zhu analyzed and interpreted the data. Yimin Liu, Hanyi Zhu and Xin Bao drafted the work. Lingyan Zheng and Huan Shi substantively revised it. All authors approved the submitted version, agreed both to be personally accountable for the own contributions and to ensure that questions related to the accuracy or integrity of any part of the work. Yimin Liu and Hanyi Zhu contributed equally to this work.
Corresponding authors
Correspondence to Lingyan Zheng or Huan Shi .
Ethics declarations
Ethics approval and consent to participate.
The study was approved by the Ethics Committee of Shanghai Jiao Tong University School of Medicine Affiliated Ninth People’s Hospital (SH9H-2021-T400-2). The Ethics Committee of Shanghai Jiao Tong University School of Medicine Affiliated Ninth People’s Hospital waived the informed consent.
Consent for publication
Competing interests.
The authors declare no competing interests.
Additional information
Publisher’s note.
Springer Nature remains neutral with regard to jurisdictional claims in published maps and institutional affiliations.
Supplementary Information
Supplementary material 1., rights and permissions.
Open Access This article is licensed under a Creative Commons Attribution-NonCommercial-NoDerivatives 4.0 International License, which permits any non-commercial use, sharing, distribution and reproduction in any medium or format, as long as you give appropriate credit to the original author(s) and the source, provide a link to the Creative Commons licence, and indicate if you modified the licensed material. You do not have permission under this licence to share adapted material derived from this article or parts of it. The images or other third party material in this article are included in the article’s Creative Commons licence, unless indicated otherwise in a credit line to the material. If material is not included in the article’s Creative Commons licence and your intended use is not permitted by statutory regulation or exceeds the permitted use, you will need to obtain permission directly from the copyright holder. To view a copy of this licence, visit http://creativecommons.org/licenses/by-nc-nd/4.0/ .
Reprints and permissions
About this article
Cite this article.
Liu, Y., Zhu, H., Bao, X. et al. When is surgical intervention needed in oral and maxillofacial space infection patients? A retrospective case control study in 46 patients. BMC Oral Health 24 , 973 (2024). https://doi.org/10.1186/s12903-024-04737-1
Download citation
Received : 17 November 2023
Accepted : 13 August 2024
Published : 22 August 2024
DOI : https://doi.org/10.1186/s12903-024-04737-1
Share this article
Anyone you share the following link with will be able to read this content:
Sorry, a shareable link is not currently available for this article.
Provided by the Springer Nature SharedIt content-sharing initiative
- Surgical intervention
- Prognostic factor
BMC Oral Health
ISSN: 1472-6831
- General enquiries: [email protected]
- Introduction
- Article Information
Kaplan-Meier survival curves showing mortality in 17 726 individuals with nonfunctional adrenal adenomas compared with 124 366 controls. All individuals with cancer discovered during the first 3 months after the diagnosis of the nonfunctional adrenal adenomas have been excluded.
eFigure 1. Overall survival by sex
eFigure 2. Overall survival by age
eFigure 3. Overall survival by adrenalectomy
eFigure 4. Overall survival in sensitivity analyses
eTable. Potential confounders
Data sharing statement
- Nonfunctional Adrenal Adenomas and Increased Risk of Mortality—Reply JAMA Internal Medicine Comment & Response January 1, 2024 Jekaterina Patrova, MD; Jonatan D. Lindh, MD, PhD; Henrik Falhammar, MD, PhD
- Nonfunctional Adrenal Adenomas and Increased Risk of Mortality JAMA Internal Medicine Comment & Response January 1, 2024 Fabio Bioletto, MD; Ezio Ghigo, MD; Mirko Parasiliti-Caprino, MD, PhD
- Nonfunctional Adrenal Adenomas and Increased Risk of Mortality JAMA Internal Medicine Comment & Response January 1, 2024 Barbara Depczynski, PhD; Myron Lee, MBBS; Andrea R. Horvath, PhD
See More About
Select your interests.
Customize your JAMA Network experience by selecting one or more topics from the list below.
- Academic Medicine
- Acid Base, Electrolytes, Fluids
- Allergy and Clinical Immunology
- American Indian or Alaska Natives
- Anesthesiology
- Anticoagulation
- Art and Images in Psychiatry
- Artificial Intelligence
- Assisted Reproduction
- Bleeding and Transfusion
- Caring for the Critically Ill Patient
- Challenges in Clinical Electrocardiography
- Climate and Health
- Climate Change
- Clinical Challenge
- Clinical Decision Support
- Clinical Implications of Basic Neuroscience
- Clinical Pharmacy and Pharmacology
- Complementary and Alternative Medicine
- Consensus Statements
- Coronavirus (COVID-19)
- Critical Care Medicine
- Cultural Competency
- Dental Medicine
- Dermatology
- Diabetes and Endocrinology
- Diagnostic Test Interpretation
- Drug Development
- Electronic Health Records
- Emergency Medicine
- End of Life, Hospice, Palliative Care
- Environmental Health
- Equity, Diversity, and Inclusion
- Facial Plastic Surgery
- Gastroenterology and Hepatology
- Genetics and Genomics
- Genomics and Precision Health
- Global Health
- Guide to Statistics and Methods
- Hair Disorders
- Health Care Delivery Models
- Health Care Economics, Insurance, Payment
- Health Care Quality
- Health Care Reform
- Health Care Safety
- Health Care Workforce
- Health Disparities
- Health Inequities
- Health Policy
- Health Systems Science
- History of Medicine
- Hypertension
- Images in Neurology
- Implementation Science
- Infectious Diseases
- Innovations in Health Care Delivery
- JAMA Infographic
- Law and Medicine
- Leading Change
- Less is More
- LGBTQIA Medicine
- Lifestyle Behaviors
- Medical Coding
- Medical Devices and Equipment
- Medical Education
- Medical Education and Training
- Medical Journals and Publishing
- Mobile Health and Telemedicine
- Narrative Medicine
- Neuroscience and Psychiatry
- Notable Notes
- Nutrition, Obesity, Exercise
- Obstetrics and Gynecology
- Occupational Health
- Ophthalmology
- Orthopedics
- Otolaryngology
- Pain Medicine
- Palliative Care
- Pathology and Laboratory Medicine
- Patient Care
- Patient Information
- Performance Improvement
- Performance Measures
- Perioperative Care and Consultation
- Pharmacoeconomics
- Pharmacoepidemiology
- Pharmacogenetics
- Pharmacy and Clinical Pharmacology
- Physical Medicine and Rehabilitation
- Physical Therapy
- Physician Leadership
- Population Health
- Primary Care
- Professional Well-being
- Professionalism
- Psychiatry and Behavioral Health
- Public Health
- Pulmonary Medicine
- Regulatory Agencies
- Reproductive Health
- Research, Methods, Statistics
- Resuscitation
- Rheumatology
- Risk Management
- Scientific Discovery and the Future of Medicine
- Shared Decision Making and Communication
- Sleep Medicine
- Sports Medicine
- Stem Cell Transplantation
- Substance Use and Addiction Medicine
- Surgical Innovation
- Surgical Pearls
- Teachable Moment
- Technology and Finance
- The Art of JAMA
- The Arts and Medicine
- The Rational Clinical Examination
- Tobacco and e-Cigarettes
- Translational Medicine
- Trauma and Injury
- Treatment Adherence
- Ultrasonography
- Users' Guide to the Medical Literature
- Vaccination
- Venous Thromboembolism
- Veterans Health
- Women's Health
- Workflow and Process
- Wound Care, Infection, Healing
Others Also Liked
- Download PDF
- X Facebook More LinkedIn
Patrova J , Mannheimer B , Lindh JD , Falhammar H. Mortality in Patients With Nonfunctional Adrenal Tumors. JAMA Intern Med. 2023;183(8):832–838. doi:10.1001/jamainternmed.2023.2442
Manage citations:
© 2024
- Permissions
Mortality in Patients With Nonfunctional Adrenal Tumors
- 1 Department of Clinical Science and Education, Södersjukhuset, Karolinska Institutet, Stockholm, Sweden
- 2 Department of Endocrinology, Södersjukhuset, Stockholm, Sweden
- 3 Department of Laboratory Medicine, Division of Clinical Pharmacology, Karolinska Institutet, Stockholm, Sweden
- 4 Department of Molecular Medicine and Surgery, Karolinska Institutet, Stockholm, Sweden
- 5 Department of Endocrinology, Karolinska University Hospital, Stockholm, Sweden
- Comment & Response Nonfunctional Adrenal Adenomas and Increased Risk of Mortality—Reply Jekaterina Patrova, MD; Jonatan D. Lindh, MD, PhD; Henrik Falhammar, MD, PhD JAMA Internal Medicine
- Comment & Response Nonfunctional Adrenal Adenomas and Increased Risk of Mortality Fabio Bioletto, MD; Ezio Ghigo, MD; Mirko Parasiliti-Caprino, MD, PhD JAMA Internal Medicine
- Comment & Response Nonfunctional Adrenal Adenomas and Increased Risk of Mortality Barbara Depczynski, PhD; Myron Lee, MBBS; Andrea R. Horvath, PhD JAMA Internal Medicine
Question Is mortality among patients with nonfunctioning adrenal tumors (NFAA) higher than in the general population?
Findings In this national retrospective register-based case-control study that included 17 726 cases and 124 366 controls, overall mortality among patients with NFAA was higher compared with controls (hazard ratio, 1.43; 95 CI, 1.38-1.48; adjusted hazard ratio, 1.21; 95% CI, 1.16-1.26) during the median follow-up period of 6.2 years (IQR, 3.3-9.6 years).
Meaning The results of this case-control study suggest that overall mortality among patients with NFAA was higher compared with controls.
Importance It is unclear if nonfunctional adrenal adenomas (NFAAs) are associated with increased mortality.
Objective To analyze mortality and causes of death in patients with NFAA.
Design, Setting, and Participants A national retrospective register-based case-control study was conducted and included 17 726 patients with a diagnosis of adrenal adenoma in Sweden from 2005 to 2019 who were identified and followed up until death or 2020 as well as 124 366 controls without adrenal adenoma. Individuals with diagnoses indicating adrenal hormonal excess or cancer were excluded. Follow-up started after 3 months of cancer-free survival following the date of the NFAA diagnosis. Sensitivity analyses were performed in subgroups of individuals for whom it was assumed that controls would also have undergone computed tomography: those with acute appendicitis (for whom it was assumed that there was no concern of cancer) and in patients with a combination of gallbladder, biliary tract, and pancreas disorders and 6-month and 12-month cancer-free survival following the date of the NFAA diagnosis. The data were analyzed in 2022.
Exposures Diagnosis of NFAA.
Main Outcomes and Measures The primary outcome was all-cause mortality among patients with NFAA after adjustment for comorbidities and socioeconomic factors. Secondary outcomes were mortality due to cardiovascular diseases and cancer.
Results Among 17 726 cases, 10 777 (60.8%) were women, and the median (IQR) age was 65 (57-73) years; among 124 366 controls, 69 514 (55.9%) were women, and the median (IQR) age was 66 (58-73) years. Among cases, overall mortality during the follow-up period (median, 6.2 years [IQR, 3.3-9.6 years]) was higher compared with controls (hazard ratio [HR] 1.43; 95 CI, 1.38-1.48; adjusted HR [aHR], 1.21; 95% CI, 1.16-1.26). The relative association of NFAA with overall mortality was similar in women and men (aHR, 1.22 [95% CI, 1.15-1.28] vs 1.19 [95% CI, 1.11-1.26]; P < .001 in both groups). In contrast, NFAA was associated with a larger increase in mortality among individuals younger than 65 years (aHR, 1.44; 95% CI, 1.31-1.58) than in older individuals (aHR, 1.15; 95% CI, 1.10-1.20; P < .001 for interaction). Mortality due to cardiovascular diseases was increased (aHR, 1.21; 95% CI, 1.13-1.29), as was mortality due to cancer (aHR, 1.54; 95% CI, 1.42-1.67). The association between NFAA and mortality remained significant and of similar magnitude in all sensitivity analyses.
Conclusions and Relevance The results of this case-control study suggest that NFAA was associated with an increased overall mortality and mortality of cardiovascular disease and cancer. The increase was more pronounced among younger individuals.
The use of abdominal imaging, such as computed tomography and magnetic resonance imaging scans, has resulted in an increased detection of adrenal tumors of unknown origin. 1 - 3 Different imaging and autopsy series with large patient numbers have reported prevalence of adrenal tumors ranging from 1.05% to 8.7%. 4 The increasing prevalence over the years is probably associated with the improvement of radiologic techniques and extensive imaging in aging populations. 3 Adrenal tumors detected on imaging performed for reasons other than suspected adrenal disease or cancer staging are called adrenal incidentalomas (AIs). 3
Most AIs are benign nonfunctional adrenal adenomas (NFAAs) with no overt hormonal secretion. 3 However, 7% to 30% of AIs are overproducing small amounts of cortisol without discernable clinical symptoms. 5 , 6 This condition is called autonomous cortisol secretion (ACS) but was previously called subclinical Cushing syndrome or subclinical hypercortisolism. 3 , 7 , 8 As diagnostic tests have false-positive rates, the true prevalence of ACS is debated. 9 Several studies have shown increased risk of obesity, 10 hypertension, and type 2 diabetes, 11 - 13 as well as higher mortality risk, 5 , 9 , 11 , 14 , 15 associated with cardiovascular diseases 9 and cancer 15 among patients with slightly increased cortisol production. It was reported that individuals with normal cortisol levels and AIs exhibit an increased incidence of type 2 diabetes, 1 dyslipidemia, and hypertension. 16 However, larger studies supporting this are needed. The aim of this study was to analyze mortality and causes of death in all patients with NFAA in Sweden.
This was a population-based retrospective cohort study. The study protocol was approved by Swedish Ethical Review Authority, and informed consent was not required due to the retrospective nature of the study. By using the unique Swedish personal identity number, data were matched and linked between several national registers. The National Patient Register (all inpatient and specialist outpatient care) data from 1997 to 2019 was used to identify diagnoses, and the Cause of Death Register using data from 2005 until 2020 was used to identify patients who had died as well as causes of death. To analyze potential additional confounders (eTable in Supplement 1 ), we also used the longitudinal integrated database for health insurance and labor market studies, which comprises detailed individual-level data on socioeconomic factors. All individuals with a first-ever International Classification of Diseases, Tenth Revision ( ICD-10 ) code of D44.1 (neoplasm of uncertain behavior of the adrenal gland) and/or D35.0 (benign neoplasm of the adrenal gland) from January 1, 2005, to December 31, 2019, were identified. Controls were randomly selected from the total population register and matched by age, sex, and municipality. Individuals with known cancer of any kind (any ICD-10 C code) diagnosed since 1997 up to 3 months after the first D44.1 or D35.0 diagnosis were excluded. Patients who had received a diagnosis of hormonal activity, such as Cushing syndrome ( ICD-10 code E24), congenital adrenal hyperplasia ( ICD-10 code E25), 17 primary aldosteronism ( ICD-10 code E26), and pheochromocytoma ( ICD-10 code E27.5), between 1997 and 2019 were excluded from both groups. By excluding all hormonally active lesions, we intended to focus on only NFAA in the study.
Although the matching was performed at the date of NFAA diagnosis, the index date (start of follow-up in the survival analysis) was set at 90 days after the first D44.1 or D35.0 diagnosis to avoid confounding by indication (ie, patients undergoing imaging due to suspected cancer that was then confirmed shortly after the imaging results that revealed the NFAA). To confirm the results, 2 more sensitivity analyses were conducted in which the index date was set to 6 and 12 months after the NFAA diagnosis. The index date in the control group was shifted similarly as cases in the different analyses. As individuals who died or received a cancer diagnosis during these periods (3, 6, and 12 months, respectively, in the different analyses) were excluded, and cases and controls were no longer perfectly matched with regard to age and sex. Thus, these variables were also adjusted for in the multivariable analysis.
We were not able to assemble a control group that was limited to persons who had undergone imaging (eg, computed tomography or a magnetic resonance imagining scan), raising the possibility that the group with the NFAA may have had an imaging examination in pursuit of a cancer diagnosis. To attempt to overcome this limitation, we conducted sensitivity analyses in 2 groups: acute appendicitis ( ICD-10 code K35) or a combination of gallbladder, biliary tract, and pancreas diseases ( ICD-10 codes K80-K87). We looked at cases and controls with acute appendicitis because of the low likelihood that their imaging was due to any concerns about cancer and because we assumed that controls with acute appendicitis also had undergone imaging. We looked at cases and controls with a diagnosis of gallbladder, biliary tract, and pancreas diseases because we would assume that cases and controls underwent an imaging examination to make the diagnosis. Cases were included if they had a K35 or a K80 to K87 diagnosis within 6 months before the D41.1 and/or D35.0 diagnosis. In the sensitivity analyses, the index date for controls was defined by the date of the first-ever K35 or K80-87 diagnosis.
Descriptive statistics included percentages, means, medians, and IQRs as appropriate. Overall and cause-specific survival probabilities were presented by means of Kaplan-Meier curves. Cases and controls were compared regarding all-cause mortality (primary outcome) as well as death due to cardiovascular diseases or cancers (secondary outcomes) using a Cox proportional hazards ratio analysis with and without adjustment for age, sex, and other potential confounders (eTable in Supplement 1 ). Given that matching between cases and controls had been done initially in the cohort, we also incorporated matching in the analysis, with each cluster comprising a case and its matched controls, except in 2 of the sensitivity analyses in which this was not possible because controls received new index dates based on K35 or K80 to K87 diagnoses. Age and sex were included as covariates in the regression model to account for any differences between cases and controls. Due to the few individuals in the sensitivity analyses based on K35 or K80 to K87 diagnoses, all longitudinal integrated database for health insurance and labor market studies variables (for which missing values would have been associated with further loss of statistical power) were removed from the model in these analyses. In addition, the variable of previous hospitalization of longer than 3 days was removed because it was inflated by the K35 or K80 to K87 episode before NFAA in cases but not in controls for whom these episodes did not precede the index date. To verify the statistical significance of the differences in adjusted hazard ratios (aHRs) seen in the subgroup analyses, the multivariable analysis of all-cause mortality was repeated post hoc after the addition of interaction terms for being 65 years or older × NFAA and sex × NFAA. The grouping variable of the third subgroup analysis, adrenalectomy, could not be analyzed as an interaction term, since the procedure was not performed in controls without NFAA. The absolute increase in mortality was calculated as the difference in 1-year mortality (total number of deaths divided by total number of years at risk) between cases and controls. Moreover, analysis of the main outcome was repeated in subgroups based on sex, age, and whether adrenalectomy had been performed. P < .05 was considered statistically significant. The statistical analysis was conducted in R, version 4.0.3 (R Foundation).
A total of 17 726 patients with NFAA and with 124 366 controls were included. Of those with NFAA, 10 777 (60.8%) were women and 6949 (39.2%) were men. The median age at the time of the NFAA diagnosis was 65 years (IQR, 57-73 years). In total, 352 of 17 726 patients (2.0%) underwent adrenalectomy. The most common comorbidities in both groups were ischemic heart disease and chronic obstructive pulmonary disease. Table 1 describes medical conditions and socioeconomic factors in the study population at the index date.
All 142 092 cases and controls entered survival analysis; median follow-up was 6.2 years (IQR, 3.3-9.6 years). Death was confirmed in 3719 of 17 726 cases (21.0%) and in 19 343 of 124 366 controls (15.6%). The overall mortality rate during the follow-up period was increased in patients with NFAA (hazard ratio [HR], 1.43; 95% CI, 1.38-1.48; aHR, 1.21; 95% CI, 1.16-1.26) ( Figure , A). The absolute increase in mortality associated with NFAA was 0.95% per year.
Table 2 presents the most common causes of death. In total, 851 of all 3719 deaths (22.9%) among patients with NFAA and 3863 of 19 343 deaths (20.0%) among controls were due to cancer. The most common types of cancer deaths in patients with NFAA were lung cancer (248 [29.1%]), pancreas cancer (78 [9.2%]), colon cancer (58 [6.8%]), prostate cancer (37 [4.3%]) and breast cancer (21 [2.5%]). Table 3 and panel B of the Figure show the crude cancer-specific (all types of cancer) survival of individuals with NFAA compared with controls. After adjusting for age, sex, and other potential confounders, cancer-related mortality was increased in patients with NFAA (aHR, 1.54; 95% CI, 1.42-1.67; P < .001).
In total, 1212 of 3719 deaths (32.6%) in patients with NFAA were due to cardiovascular diseases. Table 3 and panel C of the Figure present a Kaplan-Meier survival curve showing mortality due to cardiovascular diseases in individuals with NFAA compared with controls. After adjustment for age, sex, and other potential confounders, mortality due to cardiovascular diseases was increased in individuals with NFAA (aHR, 1.21; 95% CI, 1.13-1.29; P < .001).
The relative association of NFAA with overall mortality was essentially similar in women and men (aHR: 1.22 [95% CI, 1.15-1.28] vs 1.19 [95% CI, 1.11-1.26]; P < .001 in both groups; P = 0.20 for interaction) (eFigure 1 in Supplement 1 ; Table 3 ). Individuals younger than 65 years with NFAA had more pronounced mortality compared with same-aged individuals in the control group (aHR, 1.44; 95% CI, 1.31-1.58) than those older than 65 years (aHR, 1.15; 95% CI, 1.10-1.20; P < .001 in both groups; P < .001 for interaction) (eFigure 2 in Supplement 1 ; Table 3 ).
Among those who underwent adrenalectomy, mortality was similar to controls (aHR, 0.95; 95% CI, 0.72-1.24; P = .69). In contrast, patients with NFAA who did not undergo adrenalectomy had higher overall mortality (aHR, 1.21; 95% CI, 1.16-1.26; P < .001) (eFigure 3 in Supplement 1 ; Table 3 ).
Among individuals with acute appendicitis, overall mortality remained increased in those with an NFAA (HR, 3.08; 95% CI, 1.93-4.93; aHR, 2.34; 95% CI, 1.44-3.8; P < .001 in both). Similar findings were found in patients and controls with gallbladder, biliary tract, and pancreas diseases, whereas those with NFAA had increased mortality (HR, 2.25; 95% CI, 1.92-2.64; aHR 1.32; 95% CI, 1.1-1.59; P < .001 in both) (eFigure 4 in Supplement 1 ).
In the 2 additional sensitivity analyses, the index date was shifted to 6 and 12 months after the NFAA diagnosis and similarly in controls. All-cause mortality was still increased in patients with NFAA after shifting to 6 months (HR, 1.41; 95% CI, 1.36-1.46; aHR, 1.19; 95% CI, 1.14-1.24; P < .001 in both) and 12 months (HR, 1.40; 95% CI, 1.35-1.46; aHR, 1.19; 95% CI, 1.14-1.24; P < .001 in both).
This large population-based study addressed NFAA and encompassed 17 726 individuals with NFAA and 124 366 controls. The results suggested increased overall mortality, cancer mortality, and cardiovascular mortality in those with an NFAA. Moreover, NFAA among younger individuals, as well as those not undergoing adrenalectomy, were associated with a higher relative mortality risk.
Previous studies in patients with AIs have found increased mortality in individuals with higher cortisol levels, mainly due to cardiovascular diseases. 5 , 9 , 14 , 15 However, contrary to the present study, these studies did not exclude individuals with ACS. Moreover, only a few of the previous studies enrolled a control group without known adrenal masses. Taya et al 18 performed a retrospective cohort study with 969 patients with AI and 2907 controls. This study demonstrated higher all-cause mortality among those with AI compared with those without (aHR, 1.14; 95% CI, 1.003-1.29). Exploratory analyses, limited by missing covariates, found that AIs were associated with an increased incidence of cancer (aHR, 1.61), diabetes, heart failure, peripheral vascular disease, kidney disease, and chronic pulmonary disease compared with controls. However, only 2.8% underwent at least 1 biochemical test on adrenal function, and only 0.4% underwent evaluation of all 3 adrenal axes, so it is not known if the adrenal lesions were nonfunctioning.
A recently published multicenter study by Deutschbein et al 19 included 4374 patients with AI who were divided into 3 different groups according to cortisol levels after undergoing a dexamethasone suppression test (DST). During a follow-up of 7 years, 352 (9.6%) had died. All-cause mortality was significantly increased in patients with possible ACS (HR, 1.52; 95% CI, 1.19-1.94) and the ACS group (HR, 1.77; 95% CI, 1.20-2.62) compared with patients with nonfunctioning AI. In women younger than 65 years, a particularly high all-cause mortality was observed in those with ACS (HR, 4.39; 95% CI, 1.93-9.96).
To our knowledge, studies showing higher mortality risk due to cancer in patients with NFAA are lacking. Our group previously reported a higher mortality rate in ACS due to malignancy. 15 However, the cohort was rather small since only 16 of 365 patients died of cancer (4.4%), 6 of them had cortisol levels after undergoing a DST that were consistent with ACS (ie, >138 nmol/L), and 5 of them had levels consistent with possible ACS while the rest had normal cortisol secretion in conjunction with cancer.
Di Dalmazi et al 5 showed an increased mortality rate in patients with AI and higher cortisol levels. During follow-up, 9 of 21 individuals (43%) died due to cancer. The frequency of deaths attributable to cancer did not differ between the different groups of cortisol secretion. A recent study by Kjellbom et al 14 showed similar results. In this study, 51 of 170 patients (30%) died due to malignancy. The cohort was divided into 4 groups according to cortisol levels after DST. Mortality due to cancer was similar in all the groups.
The current study showed an increased overall mortality, as well as mortality due to nonadrenal cancer and cardiovascular diseases, in patients with NFAA compared with controls. However, the underlying reason remains to be further elucidated. Several hypothetical explanations are possible. First, NFAA at incident may be hormonally inactive, but with time, they start secreting slightly elevated amount of cortisol, which can be associated with increased mortality. However, cortisol levels may already fluctuate at the incident, which makes NFAA not so nonfunctional. This hypothesis was already supported by previous authors. 1 Increased mortality due to cardiovascular diseases in the current study potentially strengthens this hypothesis. Second, patients with NFAA could undergo more frequent radiological follow-up, which can be associated with greater rates of nonadrenal cancer. However, this still cannot explain increased mortality due to cancer. Moreover, the formation of tumors is generally facilitated by abnormal expression of growth-related genes. 20 Thus, if an adrenal tumor is found, the same factors promoting its growth can be associated with the growth of other tumors 18 (ie, the baseline tumorigenesis risk in the patients with NFAA was probably increased compared with controls). Finally, other undetected factors that coincide with NFAA may contribute to the increased risk of mortality.
To our knowledge, the current study was the first to show significantly higher overall mortality in patients with NFAA, as 23% of all deaths were associated with cancer. We speculated that some patients who underwent computed tomography imaging did so due to symptoms of cancer, which could contribute to a higher frequency of detected cancers. It could also be possible that NFAAs that were found on computed tomography images were metastases of not yet diagnosed cancer. To avoid confounding by indication, we excluded all cancer cases found within 3, 6, and 12 months in sensitivity analyses of the adrenal tumor diagnosis. Despite this, all-cause mortality remained higher compared with controls in all analyses. To support the study results, we conducted further sensitivity analyses for 2 groups of diseases for which imaging can be assumed to have been conducted for both cases and controls (ie, for cases and controls with acute appendicitis and cases and controls with gallbladder, biliary tract, and pancreas diseases). In acute appendicitis, imaging can also be assumed to have been performed without suspicion of another illness or cancer. Moreover, acute appendicitis was not expected to be associated with increased mortality, whereas gallbladder, biliary tract, and pancreas diseases may have. In both analyses, we expected similar baseline mortality in cases and controls, so any differences in mortality could be attributable to NFAA. Overall, in both analyses, mortality was still significantly increased in cases (ie, in individuals with NFAA).
The results of this study also suggested that the association between NFAA and mortality was most pronounced in individuals younger than 65 years. This finding was unexpected and so far has no clear explanation. Unlike most hormones, whose levels diminish throughout aging, mean cortisol secretion tends to increase. 21 , 22 These changes in cortisol secretion are associated with impaired cognitive status, dementia, anxiety, and depression that is associated with aging. 21 The previously published studies promote the idea that gradually rising cortisol levels with age are somehow physiological. One could assume that presence of NFAA at a young age is associated with slightly higher cortisol secretion, which could be associated with earlier development of these changes, which in turn may be associated higher mortality that would relatively affect younger people more since their overall mortality risk is lower (ie, they have fewer competing causes of mortality). Moreover, some of these NFAAs may later start producing mild excess of cortisol, and this risk may be higher in younger individuals since they have more time to develop cortisol excess.
In the current study, those few patients (n = 352) who underwent adrenalectomy had similar mortality as controls, while those who did not undergo an adrenalectomy had higher mortality than controls. It may be that healthier patients tend to be selected to undergo adrenalectomy, which is associated with better survival. However, it could be speculated that after adrenalectomy, these mildly unphysiological cortisol levels become physiological, which can be associated with a longer survival. Randomized clinical trials are needed to confirm this hypothesis.
In 2016, the European Society of Endocrinology published guidelines on the management of AI. 3 The guidelines not only suggested against repeated hormonal workup in patients with AI with normal hormonal secretion at initial evaluation, but also in those with a possible ACS, if comorbidities potentially associated with hypercortisolism, such as hypertension and type 2 diabetes, were absent. Keeping in mind further findings, follow-up was questioned, and prolonged follow-up time was suggested. 23 The latest guidelines of the American Association of Endocrine Surgeons suggest hormonal reevaluation at a 2-year to 5-year interval. 24 However, it is unclear if the patients with NFAA would benefit from greater follow-up.
This study had several limitations. We did not have access to the hormonal evaluation of the patients or radiological reports. Consequently, some individuals may have received an NFAA diagnosis despite having slightly elevated cortisol levels. Moreover, it can be assumed that patients who have cancer-related symptoms undergo radiological imaging more frequently, and even if we tried to account for that by excluding all those with a cancer diagnosis within first 3 months after the NFAA diagnosis (and 6 and 12 months in the sensitivity analyses), this may still not have been enough. Furthermore, although we adjusted for several potential confounders, such as comorbidities and socioeconomic factors, residual confounding cannot be excluded. For example, the difference between cases and controls for some comorbidities (eg, chronic obstructive pulmonary disease) was quite large, and despite adjustment, this may have affected results. However, the sensitivity analyses confirmed the main results.
In this case-control study, NFAA was associated with an increased overall mortality and mortality due to cardiovascular disease and cancer. It was more pronounced among younger individuals. Those who underwent adrenalectomy had no increased mortality.
Accepted for Publication: April 22, 2023.
Published Online: June 26, 2023. doi:10.1001/jamainternmed.2023.2442
Corresponding Author: Jekaterina Patrova, MD, Department of Clinical Science and Education, Karolinska Institutet, Södersjukhuset, Sjukhusbacken 10, 11883 Stockholm, Sweden ( [email protected] ).
Open Access: This is an open access article distributed under the terms of the CC-BY License . © 2023 Patrova J et al. JAMA Internal Medicine .
Author Contributions: Dr Lindh had full access to all of the data in the study and takes responsibility for the integrity of the data and the accuracy of the data analysis.
Concept and design: All authors.
Acquisition, analysis, or interpretation of data: Lindh, Falhammar.
Drafting of the manuscript: Patrova, Falhammar.
Critical revision of the manuscript for important intellectual content: All authors.
Statistical analysis: Lindh.
Obtained funding: Falhammar.
Administrative, technical, or material support: Patrova, Falhammar.
Supervision: Mannheimer, Lindh, Falhammar.
Conflict of Interest Disclosures: Dr Falhammar reported grants from the Magnus Bergvall Foundation during the conduct of the study. No other disclosures were reported.
Funding/Support: This project was supported by grants from the Magnus Bergvall Foundation.
Role of the Funder/Sponsor: The funding organizations had no role in the design and conduct of the study; collection, management, analysis, and interpretation of the data; preparation, review, or approval of the manuscript; and decision to submit the manuscript for publication.
Data Sharing Statement: See Supplement 2 .
- Register for email alerts with links to free full-text articles
- Access PDFs of free articles
- Manage your interests
- Save searches and receive search alerts
- Open access
- Published: 19 August 2024
Machine learning model predicts airway stenosis requiring clinical intervention in patients after lung transplantation: a retrospective case-controlled study
- Dong Tian 1 , 2 na1 ,
- Yu-Jie Zuo 1 , 3 na1 ,
- Hao-Ji Yan 4 na1 ,
- Heng Huang 1 ,
- Ming-Zhao Liu 2 ,
- Hang Yang 2 ,
- Jin Zhao 2 ,
- Ling-Zhi Shi 2 &
- Jing-Yu Chen 2
BMC Medical Informatics and Decision Making volume 24 , Article number: 229 ( 2024 ) Cite this article
165 Accesses
Metrics details
Patients with airway stenosis (AS) are associated with considerable morbidity and mortality after lung transplantation (LTx). This study aims to develop and validate machine learning (ML) models to predict AS requiring clinical intervention in patients after LTx.
Patients who underwent LTx between January 2017 and December 2019 were reviewed. The conventional logistic regression (LR) model was fitted by the independent risk factors which were determined by multivariate LR. The optimal ML model was determined based on 7 feature selection methods and 8 ML algorithms. Model performance was assessed by the area under the curve (AUC) and brier score, which were internally validated by the bootstrap method.
A total of 381 LTx patients were included, and 40 (10.5%) patients developed AS. Multivariate analysis indicated that male, pulmonary arterial hypertension, and postoperative 6-min walking test were significantly associated with AS (all P < 0.001). The conventional LR model showed performance with an AUC of 0.689 and brier score of 0.091. In total, 56 ML models were developed and the optimal ML model was the model fitted using a random forest algorithm with a determination coefficient feature selection method. The optimal model exhibited the highest AUC and brier score values of 0.760 (95% confidence interval [CI], 0.666–0.864) and 0.085 (95% CI, 0.058–0.117) among all ML models, which was superior to the conventional LR model.
Conclusions
The optimal ML model, which was developed by clinical characteristics, allows for the satisfactory prediction of AS in patients after LTx.
Peer Review reports
Introduction
Lung transplantation (LTx) has been considered the only effective therapeutic option for end-stage lung diseases. The number of lung transplants has been increasing over the last two decades, with approximately 70,000 adult lung transplants performed worldwide thus far [ 1 ]. Since the first clinical LTx in 1963, airway complications (AC) have resulted in substantial mortality and clinical LTx failure [ 2 ]. In recent years, the occurrence of AC has tended to decrease with improvements in surgical techniques, immunosuppression, and patient allocation [ 3 ]. Nevertheless, large studies have reported that the prevalence of AC remains high.
Airway stenosis (AS) refers to a fixed reduction in the caliber of the airway and is the most common AC after LTx with a reported occurrence rate ranging from 1.6%–32.0% in previous studies [ 4 , 5 , 6 , 7 , 8 , 9 ]. The onset of AS usually occurs between 2 and 9 months after LTx [ 10 , 11 ]. A reduction in the cross-sectional area > 50% is confirmation of severe AS, which reduces the quality of life and increases the morbidity and mortality of patients [ 12 ]. Severe AS requires timely clinical intervention to prevent further progression of AS [ 13 ]. Early detection of AS and treatment by balloon dilation can achieve good efficacy [ 14 ]. However, the early stages of AS are difficult to detect since they often present without specific clinical symptoms. Bronchoscopy is the gold standard for diagnosis, but it is usually used in patients who present with clinical symptoms [ 15 ]. Therefore, early and accurate detection of AS requiring clinical intervention is crucial to guide clinical decision-making about subsequent treatment.
Although the published 2018 International Society for Heart and Lung Transplantation (ISHLT) consensus statement reported risk factors for AC, the risk factors for AS remain unclear [ 4 ]. The risk factors for AS are still controversial due to the inconsistency of risk factors among different institutions [ 16 , 17 ]. In addition, the occurrence of AS is difficult to accurately predict by independent risk factors. Identification of AS status requiring clinical intervention using an accurate prediction model could be valuable to conduct optimal treatment and improve outcomes for LTx patients. However, there has been no satisfactory tool to accurately predict AS requiring clinical intervention. Machine learning (ML) algorithms, a branch of artificial intelligence, can integrate clinical characteristics to achieve accurate predictive outcomes [ 18 ]. Our prior research underscored the efficacy of ML algorithms in predicting survival outcomes in LTx patients. Building on this foundation, we endeavored to extend the application of ML models to address the prediction of AS requiring clinical intervention after LTx [ 19 ]. No published research has reported using ML algorithms to predict AS requiring clinical intervention. In this study, we assessed the clinical characteristics of patients and developed ML models to predict AS requiring clinical intervention. Moreover, the conventional logistic regression (LR) model was fitted by independent risk factors and compared in performance to the optimal ML model.
Patients who underwent LTx in Wuxi People’s Hospital affiliated with Nanjing Medical University between January 2017 and December 2019 were included. The study excluded 3 retransplant patients, 3 pediatric lung transplant patients, 2 patients who were lost to follow-up, and 2 patients with incomplete clinical records. Figure 1 shows a flow chart of the included and excluded patients. All the research procedures were consistent with the ISHLT Ethics statement. The Institutional Review Board of Wuxi People’s Hospital affiliated with Nanjing Medical University approved this study (No. 2020 [374]). Patient consent was waived due to the retrospective nature of the study.

Flow diagram for selection of lung transplant recipients. A total of 391 lung transplant recipients were assessed for eligibility. Of this cohort, patients with re-transplant, pediatric lung transplant, lost follow-up, and incomplete clinical records were excluded from the study leaving 381 patients available for the analysis
Parameter measurements
The following variables were extracted from the database: age, body mass index (BMI), sex, diagnosis, surgical type, extracorporeal membrane oxygenation (ECMO) type, ECMO support, preoperative hormone use, grade 3 primary graft dysfunction at 72 h (72 h PGD 3), operation time, postoperative ventilator time, intensive care unit (ICU) stay, postoperative 6-minute walking test (6MWT), cold-ischemia time, and arterial oxygen tension/inspired oxygen fraction (PaO 2 /FiO 2 ). Diagnoses included interstitial lung disease (ILD), chronic obstructive pulmonary disease (COPD), pulmonary arterial hypertension (PAH), and others. By definition, 72 h PGD 3 refers to the syndrome of acute lung injury over the first 72 h after LTx and is clinically manifested by diffuse alveolar infiltration on chest radiographs with PaO 2 /FiO 2 < 200 mmHg (10 mmHg = 1.33 kPa) [ 20 ]. Cold-ischemia time in single lung transplantation (SLTx) was defined as the interval between the beginning of cold perfusion of the donor lung and blood reperfusion during LTx surgery. For double lung transplantation (DLTx), the cold-ischemia time was determined at the end of reperfusion of the second lung.
Surgery and perioperative management
Since January 1, 2015, China has stopped using organs from executed prisoners, and voluntary organ donation has become the only legal source. Each bronchial anastomosis was performed in an “end-to-end” technique avoiding telescoping during LTx surgery. All recipients were treated with regular triple immunosuppressive therapy. Patients underwent routine bronchoscopy after LTx, prior to extubation and prior to discharge to assess the condition of the bronchial anastomoses, and the examination frequency was adjusted according to the actual situation. If patients have obvious airflow limitations such as respiratory distress and wheezing, relevant clinical intervention will be activated. An experienced physician (MZL) evaluated the classification of AS based on all definitions and grading systems of AS in the 2018 ISHLT consensus statement [ 4 ].
Development of the LR model and ML model
Univariate LR was used to select factors associated with AS based on our cohort. Multivariate LR included only factors with a P < 0.05 in univariate LR. A conventional LR model of AS was developed by LR using independent risk factors. For feature selection, three types of methods were used: filtering, wrapping and embedding, which aim to reduce dimension and avoid overfitting of ML models. Within these three categories of feature selection methods, seven methods were utilized , including LR, determination coefficient (DC), Relief, recursive feature elimination (RFE), Boruta, random forest (RF), and least absolute shrinkage and selection operator (LASSO). Finally, 7 groups of features were determined for the subsequent modeling. For the development of ML model , we applied eight ML algorithms, LR, decision tree (DT), k-nearest neighbors (KNN), naïve bayes (NB), support vector machine (SVM), generalized boosted regression modeling (GBRM), random forest (RF), and extreme gradient boosting (XGB). A total of 56 ML models were developed based on the 8 ML algorithms with 7 feature selection methods for predicting AS requiring clinical intervention. The model with the highest the area under the curve (AUC) was identified as the optimal ML model.
Predictive performance of the LR model and ML model
We compared the predictive performance of the conventional LR model with the optimal ML model for AS requiring clinical intervention. The performance of all models was evaluated in terms of discrimination and calibration. The AUC of the receiver operating characteristic (ROC) curve was used to evaluate the discrimination of the model. The brier score was used to assess the calibration of the model. The brier score ranges from 0 to 1; a score that is close to 0 indicates excellent calibration. Moreover, the sensitivity, specificity, positive predictive value (PPV) and negative predictive value (NPV) were also evaluated. All statistics were internally validated by the bootstrap method with 1000 resamples.
Patients were stratified into high- and low-risk groups in the optimal ML model based on the threshold determined by ROC. Mean decrease accuracy measures the extent to which each feature’s contribution to the model affects the accuracy of the prediction. It was used to identify features that contributed most significantly to the optimal ML model performance. In addition, the relative importance scores of each predictor in the optimal RF model were assessed using two metrics: Percentage Increase in MSE (percentage increase in mean square error) and Increase in Node Purity. Percentage Increase in MSE measures the impact of the variable on the prediction performance, while Increase in Node Purity measures the contribution of the variable to the purity of the decision tree nodes.
Statistical analysis
Statistical analysis was performed using IBM SPSS Statistics (version 22.0 Inc., Chicago, IL, USA), R programming language (version 4.2.1, Vienna, Austria) and GraphPad Prism (version 10.1.2, CA, USA). Patient demographics and clinical parameters were summarized as the means ± standard deviations for continuous variables and numbers with percentages for categorical variables. The odds ratio (OR) and 95% confidence interval (CI) were calculated. A value of P < 0.05 was considered statistically significant in all analyses.
Clinical characteristics
The clinical characteristics of the LTx patients are summarized in Table 1 . A total of 381 patients with 244 males and 137 females were enrolled, and the median age of patients was 57 (range, 19–82) years. In the cohort, most of the indications for LTx were ILD (N = 214) and COPD (N = 67). Regarding surgical type, the numbers of patients with SLTx and DLTx were 201 (52.8%) and 180 (47.2%), respectively. The ECMO type was venoarterial (VA) in 120 cases (31.5%) and venovenous (VV) in 150 cases (39.4%); there were 111 cases (29.1%) that did not involve ECMO. In addition, the operation time, postoperative ventilator time, ICU stay, postoperative 6MWT, cold-Ischemia time and PaO 2 /FiO 2 were 327.76 ± 98.39 min, 5.76 ± 12.42 days, 7.78 ± 10.20 days, 460.84 ± 80.58 m, 7.31 ± 2.05 h and 443.55 ± 66.40, respectively. In this study, forty (10.5%) patients encountered AS requiring clinical intervention during the follow-up period.
Univariate analysis indicated that male (OR = 3.535, 95% CI, 1.445–8.650, P = 0.006), PAH (OR = 9.651, 95% CI, 2.828–32.930, P < 0.001), VV-ECMO (OR = 0.267, 95% CI, 0.100–0.711, P = 0.008), and postoperative 6MWT (OR = 0.995, 95% CI, 0.991–0.998, P = 0.006) were significantly associated with AS requiring clinical intervention. The multivariate analysis further revealed that male (OR = 7.034, 95% CI, 2.232–22.170, P < 0.001), PAH (OR = 11.249, 95% CI, 2.554–49.549, P < 0.001), and postoperative 6MWT (OR = 0.993, 95% CI, 0.988–0.997, P < 0.001) were independent risk factors for AS requiring clinical intervention (Table 2 ). Conventional LR models were established based on independent risk factors. For the ML model, a total of 5, 5, 7, 8, 7, and 7 features were selected for modeling in the DC, Relief, RF, RFE, Boruta, and LASSO methods, respectively (Table 3 ). The combination of 7 feature selection methods and 8 ML algorithms (56 ML models) is shown in a heatmap (Fig. 2 ). The heatmap shows the AUC for the 56 ML models with a median bootstrapped AUC of 0.679 (range 0.569–0.760). The ML model using an RF algorithm with the DC feature selection method exhibited the highest bootstrapped AUC of 0.760 among the models and was confirmed to be the optimal ML model.

Heatmaps of the ML models for predicting AS requiring clinical intervention after LTx. Heatmaps illustrated the performance of each ML algorithm (columns) with each feature selection method (rows), measured by AUC. LR, logistic regression; DT, decision tree; KNN, k-nearest neighbors; NB, naïve bayes; SVM, support vector machine; GBRM, generalized boosted regression modeling; RF, random forest; XGB, extreme gradient boosting; LASSO, least absolute shrinkage and selection operator; RFE, recursive feature elimination; DC, determination coefficient; ML, machine learning; AS, airway stenosis; LTx, lung transplantation; AUC, the area under the curve
The model performance for the prediction of AS requiring clinical intervention is summarized in Table 4 . The differences emerged in the predicted values of the conventional LR and optimal ML models. The bootstrapped AUC of the optimal ML model was 0.760 (95% CI, 0.666–0.864), which was superior to the conventional LR model of 0.689 (95% CI, 0.545–0.803). The brier score of the optimal ML models was 0.085 (95% CI, 0.058–0.117), outperforming the conventional LR models of 0.091 (95% CI, 0.064–0.125). Furthermore, the sensitivity of the optimal ML model versus the conventional LR model was 0.782 (95% CI, 0.526–1.000) versus 0.680 (95% CI, 0.350–1.000). The specificity of the optimal ML model versus the conventional LR model was 0.689 (95% CI, 0.424–0.917) versus 0.623 (95% CI, 0.305–0.956). The PPV of the optimal ML model versus the conventional LR model was 0.252 (95% CI, 0.133–0.429) versus 0.236 (95% CI, 0.105–0.500). The NPV of the optimal ML model versus the conventional LR model was 0.965 (95% CI, 0.927–1.000) versus 0.952 (95% CI, 0.905–1.000).
A histogram established by the optimal threshold of 0.163 indicates different distributions in the optimal ML model between patients in the high- and low-risk groups (Fig. 3 ). The majority of patients in the high-risk groups stratified by the optimal ML model presented with AS requiring clinical intervention, while the majority of patients in the low-risk group presented without AS requiring clinical intervention.

Histogram of the predicted values in patients with and without AS requiring clinical intervention after LTx. Patients were divided into high- and low-risk patients with a cut-off value of 0.163. Most of the high-risk patients presented with AS requiring clinical intervention, while most of the low-risk patients presented without AS requiring clinical intervention. AS, airway stenosis; LTx, lung transplantation
Figure 4 illustrates the ranking of features by importance in the optimal ML model for predicting AS requiring clinical intervention. Mean decrease accuracy was calculated over the optimal ML model for the features considered in the model. The five features of the DC feature selection method were postoperative 6MWT, diagnosis, sex, ECMO type, and preoperative hormone use, with postoperative 6MWT being the most significant. Figure 5 illustrates the relative importance scores of the predictor variables in the optimal RF model. Postoperative 6MWT showed the highest Percentage Increase in MSE with Increase in Node Purity, implying that it had the greatest impact on the predictive performance of the model and contributed the most to the purity of the decision tree nodes.

Variable importance in the optimal RF model. Mean decrease accuracy calculated over the optimal RF model for the features considered in the model. 6MWT: 6-minute walking test; ECMO, extracorporeal membrane oxygenation; RF, random forest

Relative importance score in the optimal RF model. In the optimal RF model, Percentage Increase in MSE measures the impact of the variable on the prediction performance, while Increase in Node Purity measures the contribution of the variable to the purity of the decision tree nodes. 6MWT, 6-minute walking test; ECMO, extracorporeal membrane oxygenation; Percentage Increase in MSE, percentage increase in mean square error; RF, random forest
Considering the significant value of predicting AS requiring clinical intervention in patients after LTx for treatment guidance, we sought to evaluate the clinical characteristics of the patients and further construct prediction models. The following major findings were revealed in this study: (a) Postoperative 6MWT, diagnosis, sex, ECMO type, and preoperative hormone use are five important features of the optimal ML model. (b) Compared with the conventional LR model, the optimal ML model showed better performance in the prediction of AS requiring clinical intervention. (c) The predictive values of the optimal ML model could obviously distinguish patients with AS requiring clinical intervention. Our study suggests that the optimal ML model may become an effective method for predicting AS requiring clinical intervention.
The 6MWT is used to quantify the functional exercise capacity of patients with moderate to severe lung disease [ 21 ]. The negative correlation between the postoperative 6MWT and AS has been described in previous literature [ 22 ]. In our study, postoperative 6MWT was the feature with the highest importance in the optimal ML model, indicating the importance of the postoperative 6MWT in predicting AS requiring clinical intervention. PAH is a progressive hemodynamic disease characterized by proliferation and remodeling of small pulmonary arteries [ 23 ]. We confirmed that PAH is significantly associated with AS requiring clinical intervention. Patients with PAH are prone to hemodynamic instability in the early postoperative period, which may exacerbate the ischemic condition after LTx by limiting collateral blood flow and lead to development of AS. Sex was usually regarded as a potential contributor to posttransplant complications in LTx patients. The present study found that males were related to an increased probability of AS. Castleberry et al. [ 24 ] also reported similar findings. However, Van De Wauwer et al. [ 25 ] concluded that males have no negative impact on AS since the sex of the donor and recipient generally overlap. In our opinion, males, with higher levels of PGD after LTx, can have an inadequate anastomotic blood flow supply, which may induce abnormal airway remodeling and increase the occurrence of AS [ 26 ]. Additionally, lower estrogen levels in males may lack the protective effect on the airway [ 27 ]. VA-ECMO is the bridging modality for patients with respiratory failure awaiting LTx [ 28 ]. However, patients on VA-ECMO inherently demonstrate a higher risk of AS episodes since VA-ECMO is more likely to result in bleeding and thrombotic complications compared to VV-ECMO [ 29 ]. Our study emphasized the necessity of appropriate use of VV-ECMO rather than VA-ECMO in the LTx perioperative period. The present study also found that preoperative hormone use (prednisone) increased the incidence of AS, which is consistent with the study by Park et al. [ 30 ]. Kim et al. [ 31 ] reported that the AC rate did not vary significantly with preoperative hormone use. Nevertheless, they found that the incidence of AC in the first postoperative year remains high after receiving high doses of preoperative prednisone. Hence, the effects of receiving high doses of prednisone preoperatively cannot be ignored. McAnally et al. [ 32 ] concluded that preoperative hormone use may induce related complications, such as poor bronchial anastomotic healing and severe infections, which may be the reason for the increased risk of AS episodes. Therefore, reducing the preoperative dose of prednisone or discontinuing prednisone may be a feasible way to reduce the risk of AS episodes.
ML algorithm is a scientific tool that focuses on how computers learn from data [ 33 ]. It can be applied to clinical characteristics to develop robust risk prediction models and predict patient outcomes [ 34 ]. In previous studies, Hindocha et al. utilized clinical features to develop, validate, and externally test ML model. They found that the ML model might allow satisfactory predictions of survival after treatment for non-small cell lung cancer [ 18 ]. In this study, we constructed 56 ML models by clinical characteristics, and an optimal ML model was developed based on the most appropriate RF algorithm and DC feature selection method. A conventional LR model was constructed based on three independent risk factors. The discrimination, calibration, sensitivity, and specificity of the models highlighted their performance. Finally, the bootstrap method was used to internally validate the two models. The bootstrapped AUCs of the optimal ML model were higher than 0.750, indicating that the optimal ML model had acceptable discrimination. A brier score of 0.085 proves the calibration of the optimal ML model. Both discrimination and calibration demonstrated that the optimal ML model had better performance in predicting AS requiring clinical intervention compared to the conventional LR model.
The optimal ML model has higher sensitivity and specificity than the conventional LR model, further proving that it is an effective prediction model. Our study is the first to assess the predictive value of the optimal ML model for AS requiring clinical intervention in patients after LTx. The important advantage of the optimal ML model is that it exhibits excellent performance and the application of this method does not require data to conform to statistical assumptions, such as the avoidance of independent variable multicollinearity. Although the optimal ML model exhibits the best performance, not all ML models outperform the conventional LR models. Only the ML model constructed with the most appropriate ML algorithm and feature selection method performed best. Additionally, the results of our study do not completely negate the performance of the conventional LR model since they are applicable to different scenarios respectively [ 35 ].
Historically, the conventional LR model is widely used to predict the effect of variables on disease [ 36 ]. Nevertheless, the conventional LR model assumes that the contribution of all clinical characteristics to the model is linear, which is not applicable to clinical practice. ML models can be better applied to deal with high-dimensional and nonlinear clinical characteristics. Therefore, it is more suitable for clinical practice to achieve good performance. Moreover, the histogram of predicted AS requiring clinical intervention showed that the predicted outcomes and actual outcomes of the optimal ML model were approximately equal, indicating excellent performance. The majority of high-risk patients presented with AS requiring clinical intervention, and the most intensive follow-up could be performed for high-risk populations. In future studies, developing ML model by using large sample size data is warranted. The ML model could be used in clinical trials to help clinicians screen out high-risk patients and improve patient prognosis.
The limitations of this current study are presented as follows. First, being retrospective, the study had some inevitable selection bias and the results are less convincing than prospective studies. However, strict inclusion and exclusion criteria were used to control for bias. Second, we performed this study in a single center with a relatively small sample size, which limited the application of the model. Therefore, investigations with a large sample size are warranted in the future. Third, microbial infection, an important risk factor, was not evaluated in this study. As patients present with an infectious condition, they are administered the appropriate clinical intervention to suppress the infectious response, which would have an impact on our study results. Fourth, the dataset was imbalanced, with only 10% of patients developing AS. This imbalance may affect the results and the generalization ability of the ML model. Fifth, the study was limited by the absence of certain clinical characteristics such as lung function, imaging, or pathological data, which could potentially enhance the accuracy of predictions. Last, the validation process was conducted by bootstrap resampling instead of application of an independent validation set. Considering that the patient cohort consisted of only 381 individuals, we needed to keep as many samples as possible for model training in order to enhance the model’s generalization. However, bootstrapping could not provide comprehensive validation for the model.
In this study, postoperative 6MWT, diagnosis, sex, ECMO type, and preoperative hormone use were identified as five important features of the optimal ML model. We constructed ML models that can effectively predict AS requiring clinical intervention for patients after LTx with good performance. The optimal ML model outperformed the conventional LR model in predicting AS requiring clinical intervention. Multicenter studies with large data samples are warranted to further validate the model. The obtained results may enable early and accurate prediction of AS requiring clinical intervention, guiding clinical decisions for subsequent treatment. Future multi-center studies with large data samples are anticipated to further validate the model. Moreover, the deep learning model could potentially be applied to the personalized treatment of LTx patients in the future.
Availability of data and materials
The data that support the findings of this study are available from the corresponding authors upon reasonable request.
Abbreviations
- Airway stenosis
The area under the curve
Body mass index
Chronic obstructive pulmonary disease
Double lung transplantation
Decision tree
Determination coefficient
Extracorporeal membrane oxygenation
Generalized boosted regression modeling
Interstitial lung disease
Intensive care unit
International Society for Heart and Lung Transplantation
K-nearest neighbors
- Lung transplantation
Least absolute shrinkage and selection operator
- Logistic regression
- Machine learning
Naïve bayes
Negative predictive value
Positive predictive value
Percentage increase in mean square error
Pulmonary arterial hypertension
Arterial oxygen tension/inspired oxygen fraction
Random forest
Recursive feature elimination
Receiver operating characteristic
Single lung transplantation
Support vector machine
Venoarterial
Extreme gradient boosting
Grade 3 primary graft dysfunction at 72 h
6- Minute walking test
Chambers DC, Perch M, Zuckermann A, Cherikh WS, Harhay MO, Hayes D Jr, et al. The international thoracic organ transplant registry of the international society for heart and lung transplantation: Thirty-eighth adult lung transplantation report - 2021; Focus on recipient characteristics. J Heart Lung Transplant. 2021;40(10):1060–72.
Article PubMed PubMed Central Google Scholar
Hardy JD, Webb WR, Dalton ML Jr, Walker GR Jr. Lung homotransplantation in man. Jama. 1963;186:1065–74.
PubMed CAS Google Scholar
Date H, Trulock EP, Arcidi JM, Sundaresan S, Cooper JD, Patterson GA. Improved airway healing after lung transplantation. An analysis of 348 bronchial anastomoses. J Thorac Cardiovasc Surg. 1995;110(5):1424–32 discussion 32–3.
Article PubMed CAS Google Scholar
Crespo MM, McCarthy DP, Hopkins PM, Clark SC, Budev M, Bermudez CA, et al. ISHLT Consensus Statement on adult and pediatric airway complications after lung transplantation: Definitions, grading system, and therapeutics. J Heart Lung Transplant. 2018;37(5):548–63.
Article PubMed Google Scholar
Santacruz JF, Mehta AC. Airway complications and management after lung transplantation: ischemia, dehiscence, and stenosis. Proc Am Thorac Soc. 2009;6(1):79–93.
Machuzak M, Santacruz JF, Gildea T, Murthy SC. Airway complications after lung transplantation. Thorac Surg Clin. 2015;25(1):55–75.
Moreno P, Alvarez A, Algar FJ, Cano JR, Espinosa D, Cerezo F, et al. Incidence, management and clinical outcomes of patients with airway complications following lung transplantation. Eur J Cardiothorac Surg. 2008;34(6):1198–205.
Thistlethwaite PA, Yung G, Kemp A, Osbourne S, Jamieson SW, Channick C, et al. Airway stenoses after lung transplantation: incidence, management, and outcome. J Thorac Cardiovasc Surg. 2008;136(6):1569–75.
Redmond J, Diamond J, Dunn J, Cohen GS, Soliman AM. Rigid bronchoscopic management of complications related to endobronchial stents after lung transplantation. Ann Otol Rhinol Laryngol. 2013;122(3):183–9.
Felton TW, Roberts SA, Isalska B, Brennan S, Philips A, Whiteside S, et al. Isolation of Aspergillus species from the airway of lung transplant recipients is associated with excess mortality. J Infect. 2012;65(4):350–6.
Puchalski J, Lee HJ, Sterman DH. Airway complications following lung transplantation. Clin Chest Med. 2011;32(2):357–66.
Bin Saeedan M, Rizk A, Yadav R, Ghosh S. Imaging Evaluation of Airway Complications After Lung Transplant. J Comput Assist Tomogr. 2020;44(3):314–27.
Varela A, Hoyos L, Romero A, Campo-Cañaveral JL, Crowley S. Management of Bronchial Complications After Lung Transplantation and Sequelae. Thorac Surg Clin. 2018;28(3):365–75.
Chhajed PN, Malouf MA, Tamm M, Spratt P, Glanville AR. Interventional bronchoscopy for the management of airway complications following lung transplantation. Chest. 2001;120(6):1894–9.
Luecke K, Trujillo C, Ford J, Decker S, Pelaez A, Hazelton TR, et al. Anastomotic airway complications after lung transplant: clinical, bronchoscopic and CT correlation. J Thorac Imaging. 2016;31(5):W62-71.
Yserbyt J, Dooms C, Vos R, Dupont LJ, Van Raemdonck DE, Verleden GM. Anastomotic airway complications after lung transplantation: risk factors, treatment modalities and outcome-a single-centre experience. Eur J Cardiothorac Surg. 2016;49(1):e1-8.
Shofer SL, Wahidi MM, Davis WA, Palmer SM, Hartwig MG, Lu Y, et al. Significance of and risk factors for the development of central airway stenosis after lung transplantation. Am J Transplant Off J Am Soc Transplant Am Soc Transplant Surg. 2013;13(2):383–9.
Article CAS Google Scholar
Hindocha S, Charlton TG, Linton-Reid K, Hunter B, Chan C, Ahmed M, et al. A comparison of machine learning methods for predicting recurrence and death after curative-intent radiotherapy for non-small cell lung cancer: Development and validation of multivariable clinical prediction models. EBioMedicine. 2022;77: 103911.
Tian D, Yan HJ, Huang H, Zuo YJ, Liu MZ, Zhao J, et al. Machine Learning-Based Prognostic Model for Patients After Lung Transplantation. JAMA Netw Open. 2023;6(5): e2312022.
Snell GI, Yusen RD, Weill D, Strueber M, Garrity E, Reed A, et al. Report of the ISHLT working group on primary lung graft dysfunction, part I: definition and grading-A 2016 Consensus Group statement of the international society for heart and lung transplantation. J Heart Lung Transplant. 2017;36(10):1097–103.
Agarwala P, Salzman SH. Six-minute walk test: clinical role, technique, coding, and reimbursement. Chest. 2020;157(3):603–11.
Nęcki M, Latos M, Urlik M, Antończyk R, Gawęda M, Pandel A, et al. Number of Bronchoscopic Interventions in Lung Transplant Recipients Correlates with Respiratory Function Assessed by Pulmonary Function Tests. Ann Transplant. 2021;26: e927025.
Frost AE. The intersection of pulmonary hypertension and solid organ transplantation. Methodist Debakey Cardiovasc J. 2016;12(4 Suppl):10–3.
Castleberry AW, Worni M, Kuchibhatla M, Lin SS, Snyder LD, Shofer SL, et al. A comparative analysis of bronchial stricture after lung transplantation in recipients with and without early acute rejection. Ann Thorac Surg. 2013;96(3):1008–17 discussion 17–8.
Van De Wauwer C, Van Raemdonck D, Verleden GM, Dupont L, De Leyn P, Coosemans W, et al. Risk factors for airway complications within the first year after lung transplantation. Eur J Cardiothorac Surg. 2007;31(4):703–10.
Chacon-Alberty L, Ye S, Daoud D, Frankel WC, Virk H, Mase J, et al. Analysis of sex-based differences in clinical and molecular responses to ischemia reperfusion after lung transplantation. Respir Res. 2021;22(1):318.
Article PubMed PubMed Central CAS Google Scholar
Loor G, Brown R, Kelly RF, Rudser KD, Shumway SJ, Cich I, Holley CT, Quinlan C, Hertz MI. Gender differences in long-term survival posttransplant: A single-institution analysis in the lung allocation score era. Clin Transplant. 2017;31(3):10.1111/ctr.12889. https://doi.org/10.1111/ctr.12889 . Epub 2017 Feb 8.
Faccioli E, Terzi S, Pangoni A, Lomangino I, Rossi S, Lloret A, et al. Extracorporeal membrane oxygenation in lung transplantation: Indications, techniques and results. World J Transplant. 2021;11(7):290–302.
Guimbretière G, Anselmi A, Roisne A, Lelong B, Corbineau H, Langanay T, et al. Prognostic impact of blood product transfusion in VA and VV ECMO. Perfusion. 2019;34(3):246–53.
Park SJ, Nguyen DQ, Savik K, Hertz MI, Bolman RM 3rd. Pre-transplant corticosteroid use and outcome in lung transplantation. J Heart Lung Transplant. 2001;20(3):304–9.
Kim HE, Paik HC, Kim SY, Park MS, Lee JG. Preoperative Corticosteroid Use and Early Postoperative Bronchial Anastomotic Complications after Lung Transplantation. Korean J Thorac Cardiovasc Surg. 2018;51(6):384–9.
McAnally KJ, Valentine VG, LaPlace SG, McFadden PM, Seoane L, Taylor DE. Effect of pre-transplantation prednisone on survival after lung transplantation. J Heart Lung Transplant. 2006;25(1):67–74.
Deo RC. Machine Learning in Medicine. Circulation. 2015;132(20):1920–30.
Greener JG, Kandathil SM, Moffat L, Jones DT. A guide to machine learning for biologists. Nat Rev Mol Cell Biol. 2022;23(1):40–55.
Chen Z, Luo H, Xu L. Machine learning models of ischemia/hemorrhage in moyamoya disease and analysis of its risk factors. Clin Neurol Neurosurg. 2021;209: 106919.
Nick TG, Campbell KM. Logistic regression. Methods Mol Biol. 2007;404:273–301.
Download references
Acknowledgements
We would also like to thank American Journal Experts ( https://secure.aje.com/cn/researcher/ ) for editing the English text of a draft of this manuscript.
This study was supported by the National Natural Science Foundation of China (No. 82070059).
Author information
Dong Tian, Yu-Jie Zuo and Hao-Ji Yan contributed equally to this work.
Authors and Affiliations
Department of Thoracic Surgery, West China Hospital, Sichuan University, Chengdu, 610041, China
Dong Tian, Yu-Jie Zuo & Heng Huang
Wuxi Lung Transplant Center, Wuxi People’s Hospital affiliated to Nanjing Medical University, Wuxi, 214023, China
Dong Tian, Ming-Zhao Liu, Hang Yang, Jin Zhao, Ling-Zhi Shi & Jing-Yu Chen
Guangzhou Institute of Respiratory Health, the First Affiliated Hospital of Guangzhou Medical University, Guangzhou, 510120, China
Department of General Thoracic Surgery, Juntendo University School of Medicine, Tokyo, 113-8431, Japan
You can also search for this author in PubMed Google Scholar
Contributions
DT: Conceptualization, Methodology, Software, Data collection, Statistical analysis, Features extraction, Original draft. YJZ: Conceptualization, Methodology, Software, Data collection, Statistical analysis, Features extraction, Original draft. HJY: Conceptualization, Methodology, Software, Data collection, Statistical analysis, Features extraction, Original draft. HH: Methodology, Data collection, Statistical analysis, Features extraction, Manuscript editing. MZL: Software, Data collection, Statistical analysis, Manuscript editing. HY: Data collection, Features extraction, Manuscript editing. JZ: Data collection, Manuscript editing. LZS: Conceptualization, Methodology, Statistical analysis, Manuscript editing. JYC: Conceptualization, Methodology, Statistical analysis, Manuscript editing.
Corresponding authors
Correspondence to Dong Tian , Ling-Zhi Shi or Jing-Yu Chen .
Ethics declarations
Ethics approval and consent to participate.
The Institutional Review Board of Wuxi People’s Hospital affiliated with Nanjing Medical University approved this study (No. 2020 [374]). Patient does not need to provide informed consent to participate due to waiver by Institutional Review Board of Wuxi People’s Hospital affiliated with Nanjing Medical University.
Consent for publication
Not applicable.
Competing interests
The authors have no conflicts of interest to disclose.
Additional information
Publisher’s note.
Springer Nature remains neutral with regard to jurisdictional claims in published maps and institutional affiliations.
Rights and permissions
Open Access This article is licensed under a Creative Commons Attribution-NonCommercial-NoDerivatives 4.0 International License, which permits any non-commercial use, sharing, distribution and reproduction in any medium or format, as long as you give appropriate credit to the original author(s) and the source, provide a link to the Creative Commons licence, and indicate if you modified the licensed material. You do not have permission under this licence to share adapted material derived from this article or parts of it. The images or other third party material in this article are included in the article’s Creative Commons licence, unless indicated otherwise in a credit line to the material. If material is not included in the article’s Creative Commons licence and your intended use is not permitted by statutory regulation or exceeds the permitted use, you will need to obtain permission directly from the copyright holder. To view a copy of this licence, visit http://creativecommons.org/licenses/by-nc-nd/4.0/ .
Reprints and permissions
About this article
Cite this article.
Tian, D., Zuo, YJ., Yan, HJ. et al. Machine learning model predicts airway stenosis requiring clinical intervention in patients after lung transplantation: a retrospective case-controlled study. BMC Med Inform Decis Mak 24 , 229 (2024). https://doi.org/10.1186/s12911-024-02635-8
Download citation
Received : 09 April 2024
Accepted : 14 August 2024
Published : 19 August 2024
DOI : https://doi.org/10.1186/s12911-024-02635-8
Share this article
Anyone you share the following link with will be able to read this content:
Sorry, a shareable link is not currently available for this article.
Provided by the Springer Nature SharedIt content-sharing initiative
- Prediction model
BMC Medical Informatics and Decision Making
ISSN: 1472-6947
- General enquiries: [email protected]

An official website of the United States government
The .gov means it’s official. Federal government websites often end in .gov or .mil. Before sharing sensitive information, make sure you’re on a federal government site.
The site is secure. The https:// ensures that you are connecting to the official website and that any information you provide is encrypted and transmitted securely.
- Publications
- Account settings
- My Bibliography
- Collections
- Citation manager
Save citation to file
Email citation, add to collections.
- Create a new collection
- Add to an existing collection
Add to My Bibliography
Your saved search, create a file for external citation management software, your rss feed.
- Search in PubMed
- Search in NLM Catalog
- Add to Search
Comparison of lifestyle, hormonal and medical factors in women with sporadic and Lynch syndrome-associated endometrial cancer: A retrospective case-case study
Affiliations.
- 1 Department of Obstetrics and Gynecology, Tampere University Hospital, 33521 Tampere, Finland.
- 2 Laboratory of Cancer Biology, BioMediTech, University of Tampere, 33520 Tampere, Finland.
- 3 Department of Surgery, Jyväskylä Central Hospital and University of Eastern, 40620 Jyväskylä, Finland.
- 4 Department of Education and Research, Jyväskylä Central Hospital and University of Eastern, 40620 Jyväskylä, Finland.
- PMID: 28529751
- PMCID: PMC5431469
- DOI: 10.3892/mco.2017.1211
Data available on lifestyle-associated hormonal and medical factors among endometrial cancer (EC)-affected women who carry the Lynch Syndrome (LS) mutation is limited. The aim of the present retrospective case study was to compare the reproductive and medical history, as well as lifestyle-associated factors, among patients with LS and sporadic EC. The study population consisted of 50 verified germline mismatch repair (MMR) gene mutation carriers diagnosed with EC, and 110 sporadic EC patients. Data were collected using postal questionnaires. Apart from the mean age at the time of the EC diagnosis (LS, 48.7 years compared with sporadic patients, 55.2 years; P<0.0001), the characteristics of sporadic and LS EC patients were similar with regard to body mass index (BMI) at age 18, 40 or at the time of the survey, and smoking and alcohol consumption. LS women reported a significantly lower rate of spontaneous abortion (P=0.043) and also more frequent use of contraceptives (P=0.004). The prevalence of co-morbidities, including diabetes, atherosclerosis, hypercholesterolemia and hypertension, was similar between the LS and the sporadic groups. A trend for a higher prevalence of endometriosis among mutation carriers was detected (16.0 vs. 8.1%, P=0.137). As anticipated, the prevalence of gastrointestinal tract, urinary tract and ovarian cancer was higher among the LS women (P<0.0001, P=0.006 and P=0.056, respectively). Co-morbidity and lifestyle-associated factors appeared to be comparable among patients with LS and sporadic EC. The reported difference in the use of contraceptives warrants further investigation. Future studies are also required to address the possible association between LS and endometriosis.
Keywords: Lynch syndrome; endometrial cancer; lifestyle factors.
PubMed Disclaimer
Similar articles
- Gynecological Cancers in Lynch Syndrome: A Comparison of the Histological Features with Sporadic Cases of the General Population. Bounous VE, Robba E, Perotto S, Pasini B, Tomasi Cont N, Ricci MT, Ditto A, Vitellaro M, Raspagliesi F, Biglia N. Bounous VE, et al. J Clin Med. 2022 Jun 27;11(13):3689. doi: 10.3390/jcm11133689. J Clin Med. 2022. PMID: 35806973 Free PMC article.
- Histological and Somatic Mutational Profiles of Mismatch Repair Deficient Endometrial Tumours of Different Aetiologies. Ryan NAJ, Walker TDJ, Bolton J, Ter Haar N, Van Wezel T, Glaire MA, Church DN, Evans DG, Bosse T, Crosbie EJ. Ryan NAJ, et al. Cancers (Basel). 2021 Sep 10;13(18):4538. doi: 10.3390/cancers13184538. Cancers (Basel). 2021. PMID: 34572765 Free PMC article.
- Clinicopathologic Comparison of Lynch Syndrome-associated and "Lynch-like" Endometrial Carcinomas Identified on Universal Screening Using Mismatch Repair Protein Immunohistochemistry. Mills AM, Sloan EA, Thomas M, Modesitt SC, Stoler MH, Atkins KA, Moskaluk CA. Mills AM, et al. Am J Surg Pathol. 2016 Feb;40(2):155-65. doi: 10.1097/PAS.0000000000000544. Am J Surg Pathol. 2016. PMID: 26523542
- Current clinical topics of Lynch syndrome. Tanakaya K. Tanakaya K. Int J Clin Oncol. 2019 Sep;24(9):1013-1019. doi: 10.1007/s10147-018-1282-7. Epub 2018 May 9. Int J Clin Oncol. 2019. PMID: 29744602 Review.
- Identifying Lynch syndrome in patients with endometrial carcinoma: shortcomings of morphologic and clinical schemas. Clarke BA, Cooper K. Clarke BA, et al. Adv Anat Pathol. 2012 Jul;19(4):231-8. doi: 10.1097/PAP.0b013e31825c6b76. Adv Anat Pathol. 2012. PMID: 22692286 Review.
- Correlation between gynecological tumors and atherosclerotic diseases. Mulita F, Leivaditis V, Dimopoulos P, Ibra A, Iliopoulos F, Tasios K, Pitros C, Kaplanis C, Peteinaris A, Bouchagier K, Papadoulas S, Pitiakoudis M. Mulita F, et al. Arch Med Sci Atheroscler Dis. 2023 Dec 30;8:e118-e122. doi: 10.5114/amsad/176655. eCollection 2023. Arch Med Sci Atheroscler Dis. 2023. PMID: 38283923 Free PMC article.
- Descriptive study on subjective experience of genetic testing with respect to relationship, family planning and psychosocial wellbeing among women with lynch syndrome. Kalamo M, Mäenpää J, Seppälä T, Mecklin JP, Pylvänäinen K, Staff S. Kalamo M, et al. Hered Cancer Clin Pract. 2021 Sep 14;19(1):38. doi: 10.1186/s13053-021-00194-x. Hered Cancer Clin Pract. 2021. PMID: 34521458 Free PMC article.
- Factors associated with decision-making on prophylactic hysterectomy and attitudes towards gynecological surveillance among women with Lynch syndrome (LS): a descriptive study. Kalamo MH, Mäenpää JU, Seppälä TT, Mecklin JP, Huhtala H, Sorvettula K, Pylvänäinen K, Staff S. Kalamo MH, et al. Fam Cancer. 2020 Apr;19(2):177-182. doi: 10.1007/s10689-020-00158-5. Epub 2020 Jan 29. Fam Cancer. 2020. PMID: 31997047 Free PMC article.
- Energy balance related lifestyle factors and risk of endometrial and colorectal cancer among individuals with lynch syndrome: a systematic review. Coletta AM, Peterson SK, Gatus LA, Krause KJ, Schembre SM, Gilchrist SC, Pande M, Vilar E, You YN, Rodriguez-Bigas MA, Strong LL, Lynch PM, Lu KH, Basen-Engquist K. Coletta AM, et al. Fam Cancer. 2019 Oct;18(4):399-420. doi: 10.1007/s10689-019-00135-7. Epub 2019 Jun 24. Fam Cancer. 2019. PMID: 31236808 Free PMC article.
- Women's preferences for cancer risk management strategies in Lynch syndrome. Sun CC, Meyer LA, Daniels MS, Bodurka DC, Nebgen DR, Burton-Chase AM, Lu KH, Peterson SK. Sun CC, et al. Gynecol Oncol. 2019 Mar;152(3):514-521. doi: 10.1016/j.ygyno.2018.11.027. Gynecol Oncol. 2019. PMID: 30876497 Free PMC article.
- Mecklin JP, Järvinen HJ. Tumor spectrum in cancer family syndrome (hereditary nonpolyposis colorectal cancer) Cancer. 1991;68:1109–1112. doi: 10.1002/1097-0142(19910901)68:5<1109::AID-CNCR2820680535> 3.0.CO ;2-S. - DOI - PubMed
- Aarnio M, Sankila R, Pukkala E, Salovaara R, Aaltonen LA, de la Chapelle A, Peltomäki P, Mecklin JP, Järvinen HJ. Cancer risk in mutation carriers of DNA-mismatch-repair genes. Int J Cancer. 1999;81:214–218. doi: 10.1002/(SICI)1097-0215(19990412)81:2<214::AID-IJC8> 3.0.CO ;2-L. - DOI - PubMed
- Dunlop MG, Farrington SM, Carothers AD, Wyllie AH, Sharp L, Burn J, Liu B, Kinzler KW, Vogelstein B. Cancer risk associated with germline DNA mismatch repair gene mutations. Hum Mol Genet. 1997;6:105–110. doi: 10.1093/hmg/6.1.105. - DOI - PubMed
- Quehenberger F, Vasen HF, van Houwelingen HC. Risk of colorectal and endometrial cancer for carriers of mutations of the hMLH1 and hMSH2 gene: Correction for ascertainment. J Med Genet. 2005;42:491–496. doi: 10.1136/jmg.2004.024299. - DOI - PMC - PubMed
- Nieminen TT, Gylling A, Abdel-Rahman WM, Nuorva K, Aarnio M, Renkonen-Sinisalo L, Järvinen HJ, Mecklin JP, Bützow R, Peltomäki P. Molecular analysis of endometrial tumorigenesis: Importance of complex hyperplasia regardless of atypia. Clin Cancer Res. 2009;15:5772–5783. doi: 10.1158/1078-0432.CCR-09-0506. - DOI - PubMed
Related information
Linkout - more resources, full text sources.
- Europe PubMed Central
- Ingenta plc
- Ovid Technologies, Inc.
- PubMed Central
Other Literature Sources
- scite Smart Citations
Research Materials
- NCI CPTC Antibody Characterization Program
- Citation Manager
NCBI Literature Resources
MeSH PMC Bookshelf Disclaimer
The PubMed wordmark and PubMed logo are registered trademarks of the U.S. Department of Health and Human Services (HHS). Unauthorized use of these marks is strictly prohibited.
An official website of the United States government
The .gov means it’s official. Federal government websites often end in .gov or .mil. Before sharing sensitive information, make sure you’re on a federal government site.
The site is secure. The https:// ensures that you are connecting to the official website and that any information you provide is encrypted and transmitted securely.
- Publications
- Account settings
Preview improvements coming to the PMC website in October 2024. Learn More or Try it out now .
- Advanced Search
- Journal List
- Acta Biomed
- v.93(5); 2022
Retrospective observational studies: Lights and shadows for medical writers
Vincenzo de sanctis.
1 Pediatric and Adolescent Outpatient Clinic, Quisisana Hospital, Ferrara, Italy
Ashraf T Soliman
2 Pediatrics and Endocrinology Department of Pediatrics, Hamad Medical Center, Doha, Qatar and Department of Pediatrics, University of Alexandria, Alexandria, Egypt
Shahina Daar
3 Department of Haematology, College of Medicine and Health Sciences, Sultan Qaboos University, Sultanate of Oman and Stellenbosch Institute for Advanced Study (STIAS), Wallenberg Research Centre at Stellenbosch University, Stellenbosch, South Africa
Ploutarchos Tzoulis
4 Consultant Endocrinologist and Diabetologist, Whittington Hospital- UCL Medical School, London, UK
Bernadette Fiscina
5 Department of Pediatrics, NYU School of Medicine, New York, NY, USA
Christos Kattamis
6 First Department of Paediatrics, National Kapodistrian University of Athens, Athens, Greece
with the participation of the International Network of Clinicians for Endocrinopathies in Thalassemia and Adolescence Medicine (ICET-A)
* International Network of Clinicians for Endocrinopathies in Thalassemia and Adolescence Medicine (ICET-A): Atanas Banchev (Sofia, Bulgaria) , Denka Stoyanova (Sofia, Bulgaria) , Michael Angastiniotis (Nicosia, Cyprus) , Soteroula Christou (Nicosia, Cyprus), Heba Elsedfy (Cairo,Egypt), Mohamed El Kholy (Cairo, Egypt) , Doaa Khater (Alexandria, Egypt), Antonis Kattamis (Athens, Greece), Polyxeni Delaporta (Athens, Greece) , Haleh Bozorgi (Shiraz, Islamic Republic of Iran) , Mehran Karimi (Shiraz, Islamic Republic of Iran) , Saveria Campisi (Siracusa, Italy) , Salvatore Di Maio (Naples, Italy) , Carmelo Fortugno (Catanzaro Italy), Maria Concetta Galati (Catanzaro, Italy) , Giuseppe Raiola (Catanzaro, Italy) , Soad K Al Jaouni (Jeddah, Kingdom of Saudi Arabia) , Yasser Wali (Muscat, Oman) , Mohamed A Yassin (Doha, Qatar), Joan Lluis Vives Corrons (Barcelona, Catalonia, Spain) , Dulani Kottahachchi (Ragama, Sri Lanka) , Duran Canatan (Antalya, Turkey)
A retrospective study (by definition non-interventional) is a purely observational review and/or reassessment of database records with the aim of analyzing previous events of interest. The ethical and scientific standards for conducting biomedical research with humans have been established in international guidelines. Nevertheless, the reporting of ethical considerations in human research is not yet agreed upon globally, although some progress has been made in recent years. If a study has been granted exemption from ethics approval, this should be indicated in the manuscript (including the reasons for the exemption) and, if formal review by an ethics committee is not available, a statement should be included indicating that the research was conducted according to the principles of the Declaration of Helsinki. Editors play an important role in adherence to these ethical requirements for all submitted and published research papers in their journals. This short review paper focuses on the main lights and shadows of ethical aspects for conducting retrospective observational studies in humans and implications for medical writers. ( www.actabiomedica.it )
Introduction
A retrospective study (by definition non-interventional) is a purely observational review and/or a reassessment of database records to analyze events of interest that have already happened. Retrospective studies are carried out in health care settings, including but not limited to, hospitals.Various types of data sources may be available for conducting such reviews (e.g., patients’ case charts, computerized registries and others), each with specific strengths and weaknesses ( 1 ). Importantly, such studies are used to answer specific clinical problems in a relatively easy and less expensive manner.
The ethical and scientific standards for conducting biomedical research with humans have been established in international guidelines. The International Committee of Medical Journal Editors (ICMJE) offers ethical recommendations and standards in reporting of research and helps authors, editors, and all other parties involved in biomedical publishing ( 2 ). The Declaration of Helsinki ( https://www.wma.net/what-we-do/medical-ethics/declaration-of-helsinki ) advises that all research protocols must be submitted and approved by an independent research committee to ensure that the rights and interests of the subjects are protected ( 3 , 4 ). Moreover, all authors must disclose any financial and personal relationships with other people or organizations that could influence their work. Potential conflicts of interest do not necessarily preclude publication.
It is often unclear to the clinical investigator whether retrospective observational studies should be submitted to a research ethics committee (REC), mostly because no active or additional interventions are performed. Although observational studies do not involve interventions, they entail ethical concerns such as confidentiality and respect for basic patient rights according to good clinical practices. Nevertheless, the requirement of ethical standards for observational retrospective studies still varies among journals. Some journals provide general guidance and instruct authors to consult the editorial office on a case-by-case basis.
This short review paper focuses on the main ethical aspects for conducting retrospective observational studies in humans and highlights the implications for medical writers.
Ethical standards in scientific research
Ethical standards for conducting biomedical research in humans have been established through international guidelines. The new Regulation (EU) 2016/679 of April 27, 2016 ( 5 ), repealing Directive 95/46/EC, strengthens and synchronizes the rules for protecting individuals’ privacy rights and freedoms, and the World Medical Association has developed the Declaration of Helsinki ( https://www.wma. net/what-we-do/medical-ethics/declaration-of-helsinki ) as a statement of ethical principles for medical research involving human subjects; this also provides a guide to ethics committees regarding approval and informed consent ( 6 ).
The four key principles underpinning ethical research are (a) respect for autonomy, (b) beneficence, (c) non-maleficence and (d) justice.
Substantially, the two main ethical aspects for approval of clinical studies involving human subjects are that all the participants have the right to be informed in detail about the study and give informed consent, and that an ethics committee has approved the appropriateness of the project design before initiating the research.
The definition of informed consent given in Directive 2001/20/EC relating to the implementation of good clinical practice is as follows: “Informed Consent is the decision, which must be written, dated and signed, to take part in a clinical trial, taken freely after being duly informed of its nature, significance, implications and risks and appropriately documented, by any person capable of giving consent or, where the person is not capable of giving consent, by his or her legal representative; if the person concerned is unable to write, oral consent in the presence of at least one witness may be given in exceptional cases, as provided for in national legislation” ( 7 ). Informed consent of parents/legal representative must be obtained in accordance with the legislation of the host country. The investigator must also obtain that consent when the child is able to give the assent.
Although patients’ confidentiality and formal informed consent remain important ethical issues relating to record reviews, informed consent may not be obtained for individual routine analyses or diagnostic investigations beforehand because very often it is given verbally, especially in patients with chronic diseases. Moreover, in multi-centre research protocols where the research is carried out at several institutions, obtaining ethical approval from several ethics committees often results in serious delays and conflicting demands ( 8 ). Therefore, it is mandatory that the researchers who participate in studies involving human subjects, tissues, or medical records, should be familiar with the contents of the Declaration of Helsinki, as well as their local and national research standards and regulations.
The regulatory framework governing an observational study
Ethics Committees (ECs) are multidisciplinary bodies constituted to evaluate clinical experimentation and research involving human subjects and routine patient care, from an ethical and scientific point of view, in order to ensure that these abide by the ethical standards and guidelines set by national and international committees ( 9 ). These rights are protected by international agreements, such as the Helsinki Declaration, which are translated into regulations for the protection of individuals and into the rules for good research practices at the level of each country. However, the organization of the ECs varies between countries.
In general, the National Medical Ethical Committee has the authority to judge an application for the entire country. A Regional Medical Ethical Committee has the authority to judge a medical research protocol for a particular region or state but not for the entire country. In many countries a local hospital Ethical Committee called the Institutional Research Board (IRB) needs to judge the medical research protocol as well ( 9 ). In accordance with the Federal Drug Administration (FDA), the IRB has the authority to approve, disapprove, monitor, and require modifications in all research activities that fall within its jurisdiction as specified by both the federal regulations and institutional policy ( 10 ).
In Austria, studies involving the collection of retrospective medical records are classified as “Nicht-interventionellen Studie” and require only notification to the central entity. In Belgium an approval by the Regional Committee is mandatory for retrospective studies using already available data. In Italy, studies involving the collection of retrospective medical records need to be registered at the A.I.F.A (Agenzia Italiana del Farmaco) and site-specific Regional Committee approval is required. In the Netherlands, retrospective patient file research does not fall under the diction of medical research. In Switzerland, retrospective patient chart studies require neither notification nor approval by Regional Ethics Committees ( 11 ).
In the UK, according to the NHS Health Research Authority, the first step is to determine if a project is classified as research (an attempt to derive generalizable or transferable new knowledge), warranting EC review or not. If none of the following three criteria (randomization of participants to different groups, changing treatment/care from accepted standard of care, purpose of the project being to produce generalizable or transferable findings) are met, then this study is not considered research. In this case, submission to EC is not needed since this retrospective observational study is classified as clinical audit (designed to compare provided care against predetermined standards) or service evaluation (designed to measure quality of current service without reference to a standard) ( 12 ). Therefore, a simple process of registration and approval as a clinical audit by the hospital is adequate, requiring limited time and resources.
de Lange et al. ( 13 ), in a survey covering 16 European countries, have reported a large variety of ethical processes from either national ECs’, regional ECs’ or IRBs’ approval regarding an identical study protocol. In most countries, more than one level of ethical approval (EA) had to be completed. Sometimes local IRBs are stricter than their national ECs. The time between applying for EC and the first decision varied between 7 and 300 days.
In March 2022, the International Network of Clinicians for Endocrinopathies in Thalassemia and Adolescent Medicine (ICET-A) ( 14 ) promoted a survey on nationwide ethics committee regulations with regard to retrospective observational studies, containing seven questions. The main answers reported by 21 Researchers of 13 countries are summarized in Table 1 .
Table 1.
ICET-A survey on regulations of retrospective observational studies (ROS) in 13 countries.
| Country | Is Ethics Committee approval needed for ROS ? | How long do you have to wait for receiving the decision of Ethics Committee for ROS ? | Do you know if publishers in your country require Ethics Committee approval for ROS ? |
|---|---|---|---|
| | No | = | Not needed |
| | Yes | 2-4 weeks | No |
| | Yes | 1-2 months | Most of them |
| | Not mandatory, if the study can be included in the general approval already obtained for ROS. | 1-2 months | Not all of them |
| | Yes | 3 weeks | Yes |
| | No (1) Not mandatory (1) Mandatory for drug exposure studies (1) | 3-6 months | Not all of them |
| | Yes | 4-6 weeks | Yes |
| | Yes | 4-6 weeks | Yes |
| | Yes | 3-6 months | Yes |
| | Yes | 2 months | Yes |
| | Yes | 3 months | Yes |
| | Yes | 2 months | Yes |
| | Not mandatory. The possible requirement for ethical approval needs to be discussed on a case-to-case basis. | 50 days | § |
Legend: (§) Some retrospective studies undergo ethical review and approval. A large proportion is registered as clinical audit or quality improvement project with the intention of comparing clinical practice against a set of standards and criteria (defined as optimal practice) and making recommendations to improve quality of services. The key question is about the extent and scope of data collection and whether they are under the umbrella of describing real-life clinical practice or there is a broader scope.
Substantially, EA approval is mandatory in 9 out of 13 countries, the time between applying for EA and the first EC decision is extremely variable (from 2-4 weeks to 6 months) and not all editorial publishers require EC approval (including project identification code, date of approval, and name of the ethics committee or institutional review board) for retrospective observational studies.
In summary, the process for obtaining EA for retrospective observational studies may be a daunting task ( 15 ). Some researchers have argued that the waiting time between applying for EA and the first decision is unjustified because it may create significant delay and cost, may prevent some research, and can translate into potential harm to patients ( 16 ).
Therefore, an improved and uniform regulation of the exemptions from ethics review for retrospective observational studies, considered at “low-risk” in different jurisdictions, is desirable in order to help doctors working in small hospitals and to facilitate more efficient use of resources for researchers’ and ethics committees’ ( 16 , 17 ). Although there is not a clear definition of patients at “low-risk”, we may consider in this category patients who were informed of the possibility of research being performed on their data and did not object, provided their personal data would remain strictly confidential and anonymised (or at least not identifiable).
Are the ethical and endorsed statements regularly applied in clinical research?
Failure to report on informed consent and approval by an ethics review board has been described to be frequent in clinical research, even in prestigious journals.
Yank and Rennie ( 18 ) investigated the ethical protections of clinical trials published in five top medical journals:The Lancet, JAMA, BMJ, The New England Journal of Medicine, and Annals of Internal Medicine. Sixty articles per journal per period were randomly selected and assessed for rate of reporting on informed consent and on EC approval. Informed consent was not reported in 79 articles (26%) published before 1997 vs 53 (18%) published after 1997 (P =.01), and EC approval was not mentioned in 93 (31%) before 1997 vs. 54 (18%) after 1997 (P= <.001). Neither protection was described in 48 articles (16%) published before 1997 vs. 28 (9%) after 1997 (P =.01). In subgroup analyses, those journals with the worst initial rates generally improved the most.
Munung et al. ( 19 ) assessed the extent of research ethics approval and informed consent reporting in publications from Cameroon and indexed in PubMed from 2005-2009. He found that 57.53% reported ethics approval, 70.78% informed consent, and 50.68% both ethics approval and informed consent.
In 2016, Hiroi et al. ( 20 ) surveyed the ethical and endorsed statements of 10 peer reviewed medical journals with impact factors of 10 or more. General medicine, oncology, endocrinology, cardiology, gastroenterology and hepatology journals were the target of study. The authors found that some journals provided general guidance on anonymous and personally unidentifiable studies and gave instruction to authors to consult the editorial office on a case-by-case basis.
In this context, it is evident that a significant proportion of articles involved in clinical research lack reporting of ethics committee approval and written informed consent, although improvements have been observed over time.
Open problems
On the one hand, the principle of autonomy, with an emphasis on informed, autonomous decision-making of patients themselves, has in recent years supplanted the principle of non-maleficence as the primary principle guiding the practice of scientific research on humans. On the other hand, it can be argued that EC in retrospective observational studies can pose an overburdening demand on researchers, and may discourage researchers from undertaking potentially significant projects. The only possible harm involves personal privacy issues, but in many cases the physicians and scientists would be reviewing patient records they had written themselves and have free access to anyway. A practical approach to the matter of applications to ethics boards for relatively simple retrospective studies could be that individual medical researchers may be licensed by institutional review boards to perform retrospective clinical studies at their institution in their medical field (essentially being allowed to use retrospectively anonymised data of their own patients). Finally, part of the solution could lie with editorial boards which may be better situated than ethical boards in safeguarding privacy of patients by preventing publication of potentially identifiable data ( 16 ).
What action should be taken if authors cannot obtain ethics approval for a study that is merely retrospective (“non-interventional”) if they are working in a small or private clinic not affiliated to a university? Should strict ethical criteria also be applied to patients diagnosed and routinely treated according to national and international guidelines?
The ICMJE ( 2 ) has clearly mentioned that submitting publications based on observational studies requires ethical approval, or at least a letter from an EC. If no formal ethics committee is available, a statement indicating that the research was conducted according to the principles of the Declaration of Helsinki should be included. This procedure is also reported in the guidelines to authors by some international journals ( 21 ).
A clinical study is considered observational or non-interventional if it meets the following criteria: a) it does not involve a novel specific medicinal product or it involves a medicinal product that has received marketing authorization; b) the product will be used in accordance with the marketing authorization and c) the study will be conducted per standard of care ( 22 ).
The publication of retrospective research is crucial because it allows the spread of scientific knowledge, comparison of different methods of treatment, may have an impact on epidemiological surveillance, evaluation disease progression and survival, or offers the stimulus to design prospective studies.
It is often unclear to the clinical investigator whether retrospective observational studies in patients with no identifiable personal data should be submitted to an EC, mostly because no active or additional interventions are performed ( 23 ). Recent assessments have shown marked variations between research areas in the proportion of articles lacking information on external ethics review.
The proportion has been reported to range from 6% in nursing research ( 24 ) to 48 % in pediatric surgery ( 25 ), 50% in otolaryngology ( 26 ), and 31% in five prestigious medical journals in the mid-2000s ( 27 ). Articles with only one or two authors were associated with a high risk of not reporting on ethical approval. The chance of someone in the research group being experienced in ethics regulations would be greater in a larger team ( 27 ).
Medical research is subject to ethical standards that promote and ensure respect for all human subjects and protect their health and rights ( 2 ). Although retrospective observational studies do not involve interventions, and precautions are taken to protect the patients’ privacy and confidentiality, ethical considerations are not yet uniform globally, although it is acknowledged that some progress has made in recent years. If a study is granted an exemption from requiring ethics approval, this should be indicated in the manuscript (including the reasons for the exemption). If no formal ethics committee is available and the retrospective study is intended to benefit the subjects of the study, a statement indicating that the research was conducted according to the principles of the Declaration of Helsinki should be reported in the manuscript. Therefore, Editors play an important role as “gatekeepers not only of good science but of responsible science” ( 28 ) for all submitted and published research papers in their journals.
In conclusion, the decision on whether to proceed to ethics review in case of retrospective studies depends on individual IRB, journal guidelines and editor’s discretion, in accordance with the Declaration of Helsinki. It could be helpful if mandatory steps are added to online submission portals so that during submission authors can conform each of these components.
Conflict of Interest:
Each author declares that he or she has no commercial associations (e.g. consultancies, stock ownership, equity interest, patent/licensing arrangement etc.) that might pose a conflict of interest in connection with the submitted article.
Author Contributions Statement:
VDS reviewed the literature and prepared the first draft of manuscript. VDS, ATS, SD, PT and CK prepared the ICET-A survey sheet and partecipated actively to preparation of final version of manuscript. VDS, ATS, SD, PT and the Co-Authors collected the information for the ICET-A survey. BF contributed to the editing of the final version of manuscript. All the authors and co-authors approved the final version of submitted manuscript.
Ethics Approval and Consent to Participate:
Not applicable.
- Sarkar S, Seshadri D. Conducting record review studies in clinical practice. J Clin Diagn Res. 2014; 8 :JG01–4. [ PMC free article ] [ PubMed ] [ Google Scholar ]
- International Committee of Medical Journal Editors (ICMJE). Preparing for Submission. Available from: http://www.icmje.org/recommendations/browse/manuscriptpreparation/preparing-for-submission . 2016 [cited 2017 June 07] [ Google Scholar ]
- Anja van Biezen A, Ljungman P, Oneto R, et al. European Group for Blood and Marrow Transplantation. Guidelines for the Conduct of Registry Studies [ Google Scholar ]
- Vassar M, Holzmann M. The retrospective chart review: important methodological considerations. J Educ Eval Health Prof. 2013; 10 :12. [ PMC free article ] [ PubMed ] [ Google Scholar ]
- Regulation (EU) 2016/679 of the European Parliament and of the Council of 27 April 2016 on the protection of natural persons with regard to the processing of personal data and on the free movement of such data, and repealing Directive 95/46/EC. 2016 https://eur-lex.europa.eu/legal-content/IT. Accessed 21 Mar 2021. [ Google Scholar ]
- International Committee of Medical Journal Editors. Recommendations for the Conduct R. Editing, and Publication of Scholarly Work in Medical Journals. Available from: http://www.icmje.org . [Last accessed on 2016 Jan 30; Last updated in 2021] [ Google Scholar ]
- Directive 2001/20/EC of the European Parliament and of the Council of 4 April 2001 on the approximation of the laws, regulations and administrative provisions of the Member States relating to the implementation of good clinical practice in the conduct of clinical trials on medicinal products for human use. OJ L 121,1.5.2001 [ PubMed ] [ Google Scholar ]
- Research in developing countries. Bull Med Ethics. 2005; 208 :7–11. [ PubMed ] [ Google Scholar ]
- Benfatto G Regulatory Group; Ethics Committee Catania 1 (Group) Drago F. Regulatory, scientific, and ethical issues arising from institutional activity in one of the 90 Italian Research Ethics Committees. BMC Med Ethics. 2021; 22 (1):40. [ PMC free article ] [ PubMed ] [ Google Scholar ]
- Naureen Z, Beccari T, Marks RS, et al. Ethics committees for clinical experimentation at international level with a focus on Italy. Acta Biomed. 2020; 91 (13-S):e2020016. [ PMC free article ] [ PubMed ] [ Google Scholar ]
- Sluga-O’Callaghan M, Ansquer V, Frugier G, Mai C. Evolution of regulatory requirements for retrospective observational studies using medical records in Austria, Belgium, Italy, Netherlands and Switzerland. Value Health. 2018; 21 (Suppl 1):Abs. 51. [ Google Scholar ]
- http://www.hra-decisiontools.org.uk/research/docs/DefiningResearchTable_Oct2017-1 . [ Google Scholar ]
- de Lange DW, Guidet B, Andersen FH, et al. Huge variation in obtaining ethical permission for a non-interventional observational study in Europe. BMC Med Ethics. 2019; 20 (1):39. [ PMC free article ] [ PubMed ] [ Google Scholar ]
- De Sanctis V, Soliman AT. ICET-A an Opportunity for Improving Thalassemia Management. J Blood Disord. 2014; 1 (1):2. [ Google Scholar ]
- Lapid MI, Clarke BL, Wright RS. Institutional Review Boards: What Clinician Researchers Need to Know. Mayo Clin Proc. 2019; 94 :515–25. [ PubMed ] [ Google Scholar ]
- Stefansson E, Atladottir OY, GuÐbjornsson B. Are ethics rules too strict in retrospective clinical studies? Acta. Ophthalmol. 2008; 86 :588–90. [ PubMed ] [ Google Scholar ]
- Byerly WG. Working with the institutional review board. Am J Health Syst Pharm. 2009; 66 :176–84. [ PubMed ] [ Google Scholar ]
- Yank V, Rennie D. Reporting of informed consent and ethics committee approval in clinical trials. JAMA. 2002; 287 :2835–8. [ PubMed ] [ Google Scholar ]
- Munung NS, Che CP, Ouwe-Missi-Oukem-Boyer O, Tangwa GB. How often are ethics approval and informed consent reported in publications on health research in Cameroon? A five-year review. J Empir Res Hum Res Ethics. 2011; 6 :93–7. [ PubMed ] [ Google Scholar ]
- Hiroi S, Uda A, Tokaji A, Takeshima T, Iwasaki K. Ethical standards in reporting research from retrospective observational studies based on databases using anonymous and personally unidentifiable. Value Health. 2016; 19 :PRM 61. [ Google Scholar ]
- Singh N. Registration and ethics committee approval for observational studies: Current status and way forward. Med Writing. 2017; 26 :29–34. [ Google Scholar ]
- Leavy MB. Rockville (MD): Agency for Healthcare Research and Quality (US); 2018 Feb. Multinational Registries: Challenges and Opportunities: Addendum to Registries for Evaluating Patient Outcomes: A User’s Guide, Third Edition [Internet] Variations In How Observational Studies Are Defined. Available from: https://www.ncbi.nlm.nih.gov/books/NBK493601 . [ PubMed ] [ Google Scholar ]
- Belhekar MN, Bhalerao SS, Munshi RP. Ethics reporting practices in clinical research publications: A review of four Indian journals. Perspect Clin Res. 2014; 5 :129–33. [ PMC free article ] [ PubMed ] [ Google Scholar ]
- Wu Y, Howarth M, Zhou C, et al. Reporting of ethical approval and informed consent in clinical research published in leading nursing journals: a retrospective observational study. BMC Med Ethics. 2019; 20 (1):94. [ PMC free article ] [ PubMed ] [ Google Scholar ]
- Uecker M, Ure BM, Dingemann J. Ethical publication standards in articles reporting on novel surgical methods: analysis of three pediatric surgical journals. Eur J Pediat Surg. 2021; 31 :34–39. [ PubMed ] [ Google Scholar ]
- Murphy S, Nolan C, O’Rourke C, et al. The reporting of research ethics committee approval and informed consent in otolaryngology journals. Clin Otolaryngol. 2015; 40 :36–40. [ PubMed ] [ Google Scholar ]
- Schroter S, Plowman R, Hutchings A, et al. Reporting ethics committee approval and patient consent by study design in five general medical journals. J Med Ethics. 2006; 32 :718–23. [ PMC free article ] [ PubMed ] [ Google Scholar ]
- Marusic A. Editors as gatekeepers of responsible science. Biochemia Medica. 2010; 20 :282–7. [ Google Scholar ]
IMAGES
COMMENTS
A case-series is just a series of cases. For example, a physician might encounter a series of patients who all have the same disease. They then look back retrospectively to try and find associations between the patients. The difference between a retrospective case series and a retrospective case-control is that the case series lacks a control ...
Case-control study. A case-control study is an observational analytic retrospective study design [].It starts with the outcome of interest (referred to as cases) and looks back in time for exposures that likely caused the outcome of interest [13, 20].This design compares two groups of participants - those with the outcome of interest and the matched control [].
The only difference between cohort studies and case series in many definitions is that cohort studies compare different groups (i.e., ... A retrospective case series. Eur Spine J. 2016; 25 (5):1608-1613. doi: 10.1007/s00586-016-4507-3. [Google Scholar] 22. Esene IN, Ngu J, Zoghby M, Solaroglu I, Sikod AM, Kotb A, Dechambenoit G, Husseiny H ...
Retrospective cohort and case-control studies are similar but generally have differing goals. Cohort designs typically assess known risk factors and how they affect outcomes at different times. Case-control studies evaluate a particular incident, and it is an exploratory design to identify potential risk factors.
Case-control studies are retrospective. They clearly define two groups at the start: one with the outcome/disease and one without the outcome/disease. They look back to assess whether there is a statistically significant difference in the rates of exposure to a defined risk factor between the groups. See Figure 1 for a pictorial representation ...
Compared with prospective cohort studies, which involve observing a cohort of subjects with variable levels of the exposure of interest over time to relate the occurrence of the outcome of interest to the exposure, case-control studies start with case subjects and control subjects (ie, the outcome of interest is known) and look back retrospectively at the subjects' exposures to find an ...
Key points • A case series is a retrospective, noncomparative investigation that evaluates a group of patients with a known medical condition, disease state, exposure, or who have undergone a similar procedure. 1 The primary outcome of a case series is to identify a testable hypothesis that may be further evaluated with a more rigorous study design; secondary outcomes include commentary on ...
General Overview of Case-Control Studies. In observational studies, also called epidemiologic studies, the primary objective is to discover and quantify an association between exposures and the outcome of interest, in hopes of drawing causal inference. Observational studies can have a retrospective study design, a prospective design, a cross ...
The nested case-control study is a special situation in which cases and controls are both identified from within a cohort. So, ... Cohort and case-control study designs are not "opposites" as are prospective vs. retrospective, or cross-sectional vs. longitudinal, or controlled vs. uncontrolled research designs. Rather, like the randomized ...
The retrospective case-control study is an important research strategy encountered in the medical literature, and if carefully executed, can be an invaluable source of clinical information. Unfortunately, the retrospective viewpoint of case-control studies—looking "backwards" from an outcome event to an earlier exposure—is accompanied ...
Introduction. retrospective study uses existing data that have been recorded for reasons other than research. In health care these are often called "chart reviews" because the data source is the medical record. Figure 1 contrasts retrospec-tive and prospective studies. There are 3 general types of retrospective study: case report, case ...
Abstract. Retrospective studies represent an often used research methodology in the podiatric scientific literature, with cohort studies and case series being two of the most prevalent designs. Choosing a retrospective method is often dependent on multiple factors, two of the most important being details of the research question to be explored ...
A retrospective study uses existing data that have been recorded for reasons other than research. A retrospective case series is the description of a group of cases with a new or unusual disease or treatment. With a case-control study, cases with and without the condition of interest are identified, and the degree of exposure to a possible risk ...
retrospective studies are case series and cross sectional studies, while analytical retrospective studies are cross sectional, case control and cohort studies. A case series is a description of multiple, similar instructive cases; it can be used to study diseases that are rare and unusual
Retrospective case-control studies are by design more prone to selection bias than other epidemiologic studies. To be interpretable, they require that both cases and controls are representative of the same "target population." However, typically cases are identified either through a hospital or through a specialized registry, while ...
The retrospective case-control study is an important research strategy commonly encountered in the medical literature. A thoughtfully designed, carefully executed case-control study can be an invaluable source of clinical information, and physicians must often base important decisions about patient counseling and management on their interpretation of such studies.
A retrospective study looks backwards and examines exposures to suspected risk or protection factors in relation to an outcome that is established at the start of the study. Many valuable case-control studies, such as Lane and Claypon's 1926 investigation of risk factors for breast cancer, were retrospective investigations.
A retrospective study, on the other hand, looks backwards and examines exposures to suspected risk or protection factors in relation to an outcome that is established at the start of the study. Many valuable case-control studies, such as Lane and Claypon's 1926 investigation of risk factors for breast cancer, were retrospective investigations.
Nested Case-Control Studies Case-control study done in the population of an ongoing cohort study, thus "nested" inside the cohort study. In large cohorts, it is often more efficient to construct a case-control study within the cohort, once a significant number of cases have emerged, to study a specific exposure not measured at baseline.
Retrospective Case Study Review/Report. Generally completed by a retrospective review of medical records that highlights a unique treatment, case, or outcome. Often clinical in nature. A report about five or fewer clinical experiences or observations identified during clinical care. Does not involve biospecimens or FDA-regulated products (e.g ...
Background ADCY5-related dyskinesia is a rare disorder caused by mutations in the ADCY5 gene resulting in abnormal involuntary movements. Currently, there are no standardized guidelines to treat this condition. Objectives The aim of this study is to evaluate the efficacy of theophylline administration in improving symptoms and quality of life in patients with ADCY5-related dyskinesia. Methods ...
Cohort studies and case-control studies are two primary types of observational studies that aid in evaluating associations between diseases and exposures. In this review article, we describe these study designs, methodological issues, and provide examples from the plastic surgery literature. Keywords: observational studies, case-control study ...
A retrospective case‒control study was designed. From August 2020 to September 2022, patients at Shanghai Jiao Tong University Affiliated Ninth People's Hospital who were diagnosed with OMSI were retrospectively reviewed. The outcome variable was surgical intervention after the use of antibiotics. We collected common biological factors ...
Importance It is unclear if nonfunctional adrenal adenomas (NFAAs) are associated with increased mortality.. Objective To analyze mortality and causes of death in patients with NFAA.. Design, Setting, and Participants A national retrospective register-based case-control study was conducted and included 17 726 patients with a diagnosis of adrenal adenoma in Sweden from 2005 to 2019 who were ...
Overall, 389 women were included in the study, 148 in the P group, 241 in the C group. The proportion of women who went into spontaneous labor in the 24 h following TPROM was significantly lower in the P group (45% vs 64%, P < 0.001). A partial TPROM was a predictive factor for absence of labor at 24 h following rupture (adjusted odds ratio: 0. ...
The limitations of this current study are presented as follows. First, being retrospective, the study had some inevitable selection bias and the results are less convincing than prospective studies. However, strict inclusion and exclusion criteria were used to control for bias. ... a retrospective case-controlled study. BMC Med Inform Decis Mak ...
Purpose: To present the successful application of fibrin glue as a surgical adjunct in the management of complex rhegmatogenous retinal detachment (RRD).Methods: In this retrospective case series, fibrin glue was used as a surgical adjunct in 5 cases of complex RRD. In each case, standard pars plana vitrectomy and laser retinopexy were performed by the same surgeon.
The aim of the present retrospective case study was to compare the reproductive and medical history, as well as lifestyle-associated factors, among patients with LS and sporadic EC. The study population consisted of 50 verified germline mismatch repair (MMR) gene mutation carriers diagnosed with EC, and 110 sporadic EC patients. ...
A retrospective study (by definition non-interventional) is a purely observational review and/or reassessment of database records with the aim of analyzing previous events of interest. ... In conclusion, the decision on whether to proceed to ethics review in case of retrospective studies depends on individual IRB, journal guidelines and editor ...
ADOBE WORKFRONT Plan, assign, and execute work from one place. Build a marketing system of record by centralizing and integrating work across teams and applications with the industry-leading enterprise marketing work management application.